17 Feb 2016
Results of 2015 HRZ Nutrition Experiments
Summary of responses from nutrient omission experiments.
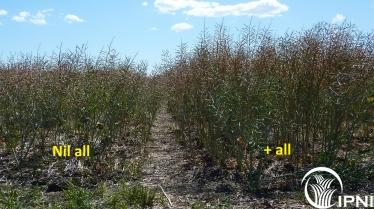 Glenthompson experiment October 2015
Summary of results
The 2015 wheat trials at Bool Lagoon and Glenthompson showed an early biomass response to N and P by anthesis, but this did not translate into higher grain yield (see Table). There was evidence that additional P led to a reduced harvest index and lower grain size, which is consistent with the crop haying off under dry soil conditions during the grain-fill period. The 2015 canola trials showed a strong response in all measured parameters to additional N at Frances and both N and P at Inverleigh. There were positive grain yield and HI responses to S in wheat at Bool Lagoon in 2015, but negative responses to S at anthesis in wheat at Glenthompson (2015). Across all sites there wa only one significant response to micronutrients, which was for wheat (grain) at Glenthompson, and did not translate to a higher grain yield.
Summary of significant effects of applied nutrients in the 2015 omission trials. Values separated by different letters are significantly different at the 5% level. For N effects, 2 lsd’s are shown. The first is for comparison between the lowest and middle rate, the second for comparisons between the middle and highest rate. This is because the lowest N rate was only applied to the Nil and +all treatments, whereas the middle and highest N rate were applied to all treatments.
| Site | Parameter | Response to… | Description of significant differences | 5% lsd | |
| Frances (canola) | Grain yield (t/ha, 100 C drying) | N | 18 kg N/ha | 0.64b | 0.163 |
| 95 kg N/ha | 0.89a | 0.126 | |||
| 174 kg N/ha | 0.94a | ||||
| Biomass – 11 September (kg/ha) | N | 18 kg N/ha | 2326b | 660 | |
| 95 kg N/ha | 2632b | 461 | |||
| 174 kg N/ha | 3396a | ||||
| Harvest Index | Not significant | 0.243 | |||
| Biomass at grain harvest (t/ha) | N | 18 kg N/ha | 2.76c | 0.52 | |
| 95 kg N/ha | 3.62b | 0.40 | |||
| 174 kg N/ha | 4.04a | ||||
| Bool Lagoon (wheat) | Grain yield (t/ha, 100 C drying) | N, S | 18 kg N/ha | 3.50a | 0.459 |
| 64 kg N/ha | 3.05b | 0.320 | |||
| 149 kg N/ha | 3.45a | ||||
| 0 kg S/ha | 3.12b | 0.356 | |||
| 23 kg S/ha | 3.55a | ||||
| Visual rating 28 Oct (scored 1-5) | N, P | 18 kg N/ha | 1.50c | 0.334 | |
| 64 kg N/ha | 1.76b | 0.233 | |||
| 149 kg N/ha | 1.99a | ||||
| 0 kg P/ha | 1.54b | 0.260 | |||
| 25 kg P/ha | 1.97a | ||||
| Biomass at grain harvest (t/ha) | P | 0 kg P/ha | 7.67b | 0.396 | |
| 25 kg P/ha | 8.42a | ||||
| Harvest index | P, S | 0 kg P/ha | 0.456a | 0.0337 | |
| 30 kg P/ha | 0.421b | ||||
| 0 kg S/ha | 0.377b | 0.0337 | |||
| 23 kg S/ha | 0.439a | ||||
| Site | Parameter | Response to… | Description of significant differences | 5% lsd | |
| Glenthompson (wheat) | Grain yield (t/ha, 100 C drying) | Not significant | 4.32 | ||
| Harvest Index | Not significant | 0.41 | |||
| Grain protein (%) | Not significant | 13.0 | |||
| Grain weight (g/1000 grain) | P (P = 0.09) | 0 kg P/ha | 33.2a | 1.53 | |
| 25 kg P/ha | 31.9b | ||||
| Anthesis biomass – 23 October (kg/ha) | N, P
S (P = 0.08) | 18 kg N/ha | 9369b | 438 | |
| 77 kg N/ha | 9807a | ||||
| 0 kg P/ha | 9033b | 534 | |||
| 25 kg P/ha | 9688a | ||||
| 0 kg S/ha | 10007 | 534 | |||
| 23 kg S/ha | 9449 | ||||
| Ear density – 23 October (ears/m2) | P | 0 kg P/ha | 425b | 30.3 | |
| 25 kg P/ha | 463a | ||||
| Flag leaf mass – October (g/m2) | N | 18 kg N/ha | 18.7b | 1.31 | |
| 77 kg N/ha | 21.5a | ||||
| Biomass at grain harvest (t/ha) | Micronutrients (P = 0.1) | None | 10.6 | 0.69 | |
| +Cu, Zn | 11.2 | ||||
| Inverleigh (canola) | Grain yield (t/ha, 100 C drying) | N, P | 18 kg N/ha | 1.34b | 0.252 |
| 75 kg N/ha | 1.60a | 0.173 | |||
| 146 kg N/ha | 1.69a | ||||
| 0 kg P/ha | 1.38b | 0.196 | |||
| 25 kg P/ha | 1.69a | ||||
| Biomass at grain harvest (t/ha) | N, P | 18 kg N/ha | 5.16b | 0.770 | |
| 75 kg N/ha | 5.72ab | 0.527 | |||
| 146 kg N/ha | 6.02a | ||||
| 0 kg P/ha | 5.12b | 0.599 | |||
| 25 kg P/ha | 6.00a | ||||
| Harvest Index | N, P (P = 0.07) | 18 kg N/ha | 0.279 | 0.0336 | |
| 75 kg N/ha | 0.292 | 0.0199 | |||
| 146 kg N/ha | 0.293 | ||||
| 0 kg P/ha | 0.282 | 0.0218 | |||
| 25 kg P/ha | 0.294 | ||||
| Oil content (% oil at 6% moisture) | N, P | 18 kg N/ha | 46.04a | 0.529 | |
| 75 kg N/ha | 43.49b | 0.362 | |||
| 146 kg N/ha | 42.63c | ||||
| 0 kg P/ha | 42.39b | 0.411 | |||
| 25 kg P/ha | 43.41a | ||||
| Oil yield (t/ha) | N, P | 18 kg N/ha | 0.690b | 0.1248 | |
| 75 kg N/ha | 0.777ab | 0.0853 | |||
| 146 kg N/ha | 0.806a | ||||
| 0 kg P/ha | 0.652b | 0.0970 | |||
| 25 kg P/ha | 0.818a | ||||
| Protein content (%, 6% moisture) | N, P | 18 kg N/ha | 36.6c | 0.844 | |
| 75 kg N/ha | 40.2b | 0.577 | |||
| 146 kg N/ha | 41.9a | ||||
| 0 kg P/ha | 42.2a | 0.656 | |||
| 25 kg P/ha | 40.5b | ||||
| Protein yield (t/ha) | N, P | 18 kg N/ha | 0.282c | 0.0600 | |
| 75 kg N/ha | 0.386b | 0.0241 | |||
| 146 kg N/ha | 0.431a | ||||
| 0 kg P/ha | 0.358b | 0.0467 | |||
| 25 kg P/ha | 0.412a |
Additional Resources
Crop Nutrient Decisions in HRZSize: 9.34 MB
Results Report from SFSSize: 0.61 MB