30 Jul 2015
Background to Omission Trials
Summary of HRZ omission trials treatments and seasonal conditions
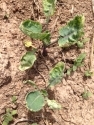
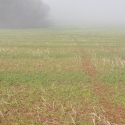
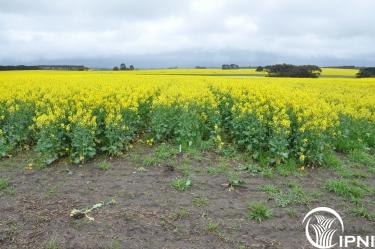 Canola experiment Tarringto, 2016
Seasonal Conditions:
2015 - The rainfall across the HRZ was at Decile 1 for the year (Table 1), with very hot conditions (40oC plus) during early grain filling.
To date, 2016 has been one of the wettest on record.
Table 1. Growing season rainfall (April-November inclusive) at Naracoorte, Lake Bolac and Winchelsea during the omission trial experiment (2015) and deciles relative to the 1900-2015 period.
| Location | Relevant to sites at… | Year | Rainfall (mm/yr) | Decile |
| Naracoorte | Bool Lagoon/Frances | Average | 408 | |
2015 | 262 | 1 | ||
2016 | ||||
| Lake Bolac | Chatsworth | Average | 399 | 5 |
2015 | 260 | 1 | ||
| Hamilton | Tarrington/Hamiton | Average | ||
2016 | ||||
| Rutherglen | Rutherglen | Average | ||
2016 | ||||
| Winchelsea | Inverleigh | Average | 466 | 5 |
2015 | 260 | 1 | ||
2016 |
Soil Samples:
The results of the soil tests taken prior to sowing for each of the sites are shown in Table 2.
Pre-sowing soil tests indicate that the 2015 sites all exceeded the currently accepted critical value for all nutrients tested for topsoil (0-10 cm ) criteria, except S for canola at Frances and Inverleigh (Table 5). Samples of the deeper soil indicated S and K tended to increase down the profile at many sites. The relatively high K and S levels at depth are likely to reduce the likelihood of crop responses to those nutrients at most of these sites.
Table 2 Initial soil mineral N (nitrate + ammonium) to a depth of 90 cm, and topsoil (0-10 cm) available P (Colwell), K (ammonium acetate, calculated as equivalent to a Colwell K extract) and S (KCl-40), and critical values at which 95% of maximum yield from the Better Fertilizer Decisions database (Bell et al. 2013a, Brennan and Bell 2013, 2013b, Anderson et al. 2013).
| Site | N
(kg/ha) | P
(mg/kg) | K
(mg/kg) | S
(mg/kg) |
| 2015 | ||||
| Bool Lagoon (wheat) | 55* | 27 | 1017 | 8.8 |
| Chatsworth (wheat) | 124 | 53 | 112 | 29.5 |
| Frances (canola) | 76 | 32 | 155 | 6.7 |
| Inverleigh (canola) | 84 | 58 | 254 | 6.8 |
| 2016 | ||||
| Bool Lagoon (wheat) | 43* | 24 | 1050 | 7.2 |
| Inverleigh (wheat) | 199 | 84 | 290 | 12.5 |
| Bool Lagoon (canola) | 28* | 24 | 1250 | 6.2 |
| Tarrington (canola) | 276 | 62 | 210 | 16.8 |
| Rutherglen (canola) | 100 | 19 | 280 | 7.2 |
| Hamilton (canola) | 829 | 90 | 150 | 32.0 |
| Critical value (wheat) | 22 | 40 | 3.1 | |
| Critical value (canola) | 22 | 46 | 7.1 |
Nutrient Addition Rates
Rates of nutrient supplied in the omission trials are high enough so that that nutrient is not limiting. The exception is nitrogen which was supplied at rates equal to 60% or 100% of the estimated water-limited yield potential.
Table 3. Rates of nutrient (kg/ha) applied in the omission experiments in 2015 and 2016. Rates of N, P, K, S, Cu and Zn at sowing were consistent across all sites, whereas in-crop N varied from site and year.
| Nutrient/site (2015) | 2015 | Site (2016) | 2016 |
| Sowing | kg/ha | kg/ha | |
| N | 18,18, 30 | 30, 30, 30 | |
| P | 0, 25 | 0, 50 | |
| K | 0, 50 | 0, 50 | |
| S | 0, 24 | 0, 20 | |
| Zn | 0, 1.1 | 0, 1.1 | |
| Cu | 0, 2 | 0, 2 | |
| In-crop N | |||
| Bool Lagoon (wheat) | 0, 46, 110 | Bool Lagoon (wheat) | 0, 134, 247 |
| Glenthompson (wheat) | 0, 0, 39 | Inverleigh (wheat) | 0, 63, 236 |
| Frances (canola) | 0, 57, 106 | Bool Lagoon (canola) | 0, 64, 157 |
| Inverleigh (canola) | 0, 57, 106 | Tarrington (canola) | 0, 49,185 |
| Rutherglen (canola) | 0, 229, 366 |
Additional Resources
Crop Nutrient Decisions in the HRZSize: 9.34 MB