07 Feb 2014
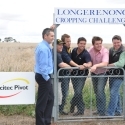
Results from the 2013 Longerenong Cropping Trial
Barley yields and costs for 2013
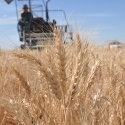
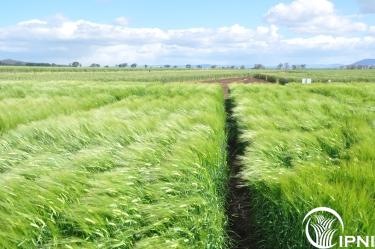 Barley Crop
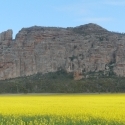
In its fourth year at the same site at Longerenong College, the crop competition teams developed agronomy programs to produce the best barley crops. The sites were in canola in 2010, wheat in 2011 and chickpea in 2012 and the teams have kept to the same plots in this replicated comparison. Even though the season was a decile 3 overall and nearly 50 mm below the long term average annual rainfall, the wet winter and mild spring meant most rainfall was during the crop growing season and so gave excellent crop yields overall (Table 1).
Table 1. Monthly rainfall, Longerenong, 2013.
Month 2013 | Jan | Feb | Mar | Apr | May | Jun | Jul | Aug | Sep | Oct | Nov | Dec | Annual |
Rainfall (mm) | 0 | 22 | 4 | 15 | 25 | 64 | 64 | 50 | 61 | 34 | 13 | 9 | 361 |
Long-term Average | 25 | 24 | 23 | 29 | 43 | 44 | 43 | 44 | 40 | 42 | 31 | 28 | 417 |
Decile | 1 | 6 | 2 | 3 | 3 | 8 | 8 | 5 | 8 | 4 | 3 | 3 | 3 |
The highest yield for barley this year went to the BCG, DPI, LAC students, Pacific Seeds and VNTFA who had yields that were no significantly different to the top yield of 5.79 t/ha (VNTFA). These are spectacular yields and show what good management can do if the seasons are kind.
Table 2 below shows the grain yield, the price recieved, cartage and growing costs and the crop annual gross margins, and the VNTFA were able to show the highest return, although 4 other teams had gross margins over $1000/ha for this phase. The prices for barley depended on the variety grown - with all except the students and the VNTFA achieving Malt. The other grain was all F1.
Table 2, Barley yield, grain price, crop costs and annual gross margin for barley at the Longerenong cropping competition, 2013.
| Team | Yield | Price ($/t) | Cartage ($10/t) | Crop Costs | Gross Margin ($/ha) |
| Agritech | 4.89 | 205 | 49 | 46 | 907 |
| BCG | 5.68 | 205 | 57 | 72 | 1036 |
| DPI | 5.71 | 205 | 57 | 45 | 1069 |
| Green Machine | 5.16 | 205 | 52 | 67 | 939 |
| IPL | 5.10 | 205 | 51 | 45 | 949 |
| Late Sowing | 4.69 | 220 | 47 | 14 | 970 |
| Longy Lecturers | 5.50 | 205 | 55 | 83 | 989 |
| Longy students | 5.64 | 205 | 56 | 56 | 1044 |
| Nuseed Nufarm | 5.04 | 205 | 50 | 41 | 943 |
| Pacific Seeds | 5.60 | 205 | 56 | 44 | 1048 |
| Raging Reds | 4.86 | 205 | 49 | 108 | 840 |
| SMS Rural | 5.40 | 205 | 54 | 57 | 996 |
| Tylers Agwise | 5.06 | 205 | 51 | 68 | 918 |
| Vic No Till | 5.79 | 220 | 58 | 109 | 1107 |
| LSD | 0.25 |
When included over the four years of the competition, the gross margins are as in Table 3. Two treatments - late sowing and the Nufarm Nuseed treatments came in after 2010. Over the four years, canola has been the most profitable crop on average, followed by barley, chickpea and then wheat. Over the four years, the Longy Students achieved the highest aggregate (4 year) gross margin of $2878/ha - which interestingly enough was about $500 more than their lecturers.
Table 3. Gross margins ($/ha) for the four years of the Longerenong Crop Competition, 2010-2013.
Canola | Wheat | Chickpea | Barley | ||
| Team name | Return ($/ha) | Return ($/ha) | Return ($/ha) | Return ($/ha) | 4 Year GM ($) |
| Agritech | 1383 | 357 | 796 | 907 | 2536 |
| BCG | 1033 | 396 | 849 | 1036 | 2278 |
| DPI | 1279 | 530 | 960 | 1069 | 2769 |
| Green Machine | 1189 | 351 | 869 | 939 | 2409 |
| IPL | 1424 | 530 | 792 | 949 | 2746 |
| Late Sowing | - | 305 | 897 | 970 | |
| Longy Lecturers | 1007 | 414 | 961 | 989 | 2382 |
| Longy Students | 1513 | 359 | 1006 | 1044 | 2878 |
| Nufarm Nuseed | - | 508 | 613 | 943 | |
| Pacific Seeds | 1423 | 528 | 751 | 1048 | 2702 |
| Raging Reds | 1229 | 456 | 991 | 840 | 2676 |
| SMS Rural | 1555 | 366 | 727 | 996 | 2648 |
| Tylers /Agwise | 1001 | 582 | 759 | 918 | 2342 |
| VTNFA | 1290 | 550 | 634 | 1107 | 2475 |
| Average | 1277 | 445 | 829 | 983 | 2570 |
Additional Resources
Spreadsheet of Agronomy Summary and Costs 2013Size: 0.03 MB