13 Feb 2013
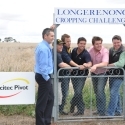
Longerenong Cropping Challenge 2012
Summary of results for the 2012 Chickpea Challenge
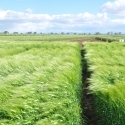
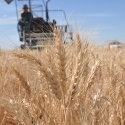
 Chickpea crop
Thanks to the groups who participated again - despite a very dry season, chickpea crops yielded quite well with many above 2 t/ha and the IPL team achieving the highest yield of 2.48 t/ha which was similar to the yields of the crops managed by the Greenmachine (2.27 t/ha), the Raging Reds (2.24 t/ha) and the Longy students.
The highest gross margin - over $1000 per hectare went to the Longy Students, with the Raging Reds not far behind. Overall, these were great gross margnins and reflect the careful selection of the variety and the good management of the crop.
The results over the three years - Canola 2010, Wheat 2011 and Chickpeas 2012 are being collated and this will give a view of the longer term strategies for crop management.
The seasonal conditions started off well with good rains after sowing but the spring failed to appear which constrained yields although it would have also restricted fungal diseases. The year ended up as a decile one year and crop yields were really quite good - suggesting the wet summer of 2010/11 was still supplying stored water to these crops.
Month 2012 | Jan | Feb | Mar | Apr | May | Jun | Jul | Aug | Sep | Oct | Nov | Dec | Annual |
Rainfall (mm) | 6.6 | 3.8 | 35.8 | 11.8 | 41.2 | 59.6 | 51.6 | 29.6 | 35 | 12.6 | 10.8 | 16.4 | 314.8 |
Long-term Average | 24.7 | 23.6 | 23.1 | 28.9 | 42.8 | 44.2 | 42.9 | 43.8 | 40.4 | 41.8 | 31 | 28.1 | 417 |
Decile | 2 | 2 | 7 | 2 | 5 | 7 | 6 | 3 | 4 | 1 | 2 | 4 | 1 |
Discussion Points from the season
- Most teams were active in fungal diease and insect control, and the samples produced reflected that with good clean seed resulting.
- For chickpea, a major cost is the seed, which can make up to half the variable costs for the crop. Obviously higher seeding rates contribute to added costs.
- Two groups opted to use no fertilizer, while most use 10 kg P. The Colwell P soil tests at the start of the crop were generally 30-40 mg/kg which would be considered sufficient or at least at maintenance levels for this soil type, and the low fertilizer input resulted in reasonable yields for one group, but lower yields for another group. One group entered with a soil test of 26 mg/kg but this did not seem to adversly effect yields in this case. Chickpea is know to be able to access less available P pools in the soil when compared to cereals.
- The two top yielding groups planted Slasher, whiile the variety Kalkee seemed somewhat lower yielding than either Slasher or Genesis90 in this experiment.
- Sowing time did not have a great influence on yields, with the highest yielding group planted either on May 28 or June 15, with the lowest yielding group showing the same spread of dates. It may be that performance was more due to stored water in this season due to the dry spring. There were no really early plantings to compare.
- Crop price varied and Kalkee attracted a premium over both Slahser and Kalkee - and this led to some large differences in final gross margins.
- Even so, the higher yield of Genesis90 in this experiment meant that the top 3 gross margins were returned from Genesis90 crops.
Summary table of the results:
| Team | Chemical $ /Ha | Fertiliser $/Ha | Seed Dressing $/Ha | Harvest $/ha* | Total /Ha | Mean Yield (t/ha) | Price $/t | Gross Margin $/ha |
| Agritech | 21.7 | 24.8 | 104.5 | 58.1 | 209.0 | 1.81 | 556 | 796 |
| BCG | 46.7 | 21.7 | 115.8 | 55.3 | 239.4 | 1.53 | 713 | 849 |
| DPI | 71.4 | 38.5 | 154.7 | 57.5 | 322.0 | 1.75 | 734 | 960 |
| IPL | 26.8 | 50.1 | 104.5 | 64.8 | 246.1 | 2.48 | 450 | 869 |
| Landmark (Green Machine) | 26.8 | 36.0 | 104.5 | 62.7 | 230.0 | 2.27 | 450 | 792 |
| Late Sowing | 54.3 | 24.8 | 134.0 | 56.2 | 269.4 | 1.62 | 720 | 897 |
| Longy Lecturers | 16.8 | 0.0 | 106.7 | 60.2 | 183.7 | 2.02 | 566 | 961 |
| Longy students | 16.8 | 15.5 | 104.5 | 61.7 | 198.4 | 2.17 | 556 | 1006 |
| Nuseed Nufarm | 61.5 | 24.8 | 125.4 | 51.9 | 263.6 | 1.19 | 735 | 613 |
| Pacific Seeds | 50.8 | 24.8 | 115.0 | 54.1 | 244.7 | 1.41 | 707 | 751 |
| Raging Reds | 57.7 | 31.0 | 123.6 | 62.4 | 274.7 | 2.24 | 565 | 991 |
| SMS Rural | 50.5 | 21.0 | 104.5 | 53.6 | 229.6 | 1.36 | 701 | 727 |
| Tylers Agwise | 21.4 | 31.0 | 104.5 | 53.0 | 209.9 | 1.30 | 743 | 759 |
| VNTFA | 45.2 | 0.0 | 127.6 | 55.3 | 228.1 | 1.53 | 563 | 634 |
Additional Resources
Agronomy SummarySize: 0.05 MB
Crop Protection SummarySize: 0.05 MB
Crop Quality and PriceSize: 0.04 MB


