16 Feb 2012
Oaten Hay yields at the Dahlen Long-term N*P experiment
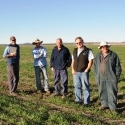
An Incitec Pivot research project, managed by IPNI ANZ Regional Director Rob Norton
Established in 1996, this site 10 km west of Horsham has had five rates of N (0, 20, 40, 80, 160 kg as urea) and four rates of P (0, 9, 18, 36 kg as triple super) applied annually over the past 16 years. The site was been direct drilled and no stubbles have been removed or burned. In 2011, the whole site was sown to oats as a hay crop, with the existing fertilizer regime continuing.
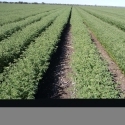
The oats were sown in mid-May and the standing crop cut on 20 September when the heads were still in the flag leaf. This hay cutting time was a little earlier than normal, as many growers would wait until ear emergence, however, delaying cutting usually increase biomass produced, but the quality declines. The site mean yield was around 6 t/ha of dry matter and samples from each plot were tested for quality through Feedtest (digestibility, crude protein, neutral detergent fibre and the estimated metabolizable energy) as well as the mineral nutrient content.
The effect of added P was clear in this experiment, with the first 9 kg of P giving a 77% increase in dry matter, and the next 9 kg giving an additional 24% (Table 1). The higher hay yield however was of a lower quality, with lower crude protein, higher fibre content and a lower ME.
Table 1 The effect of phosphorus application on the quality of oaten hay.
P | CP% | NDF% | DDM% | ME MJ/kg | Ptn Yld kg/ha | DDM t/ha | MJ/ha |
0 | 13.2 | 41.0 | 78.2 | 11.8 | 441 | 2.64 | 39914 |
9 | 11.2 | 46.9 | 72.5 | 10.9 | 668 | 4.32 | 64650 |
18 | 10.2 | 50.0 | 69.6 | 10.4 | 702 | 4.75 | 70631 |
36 | 9.8 | 49.4 | 69.9 | 10.4 | 748 | 5.25 | 78168 |
LSD (p<0.05) | 0.52 | 1.2 | 0.9 | 0.2 | 50 | 0.26 | 2370 |
Figure 1 – Dahlen oaten hay P response, 2011.
According to the Victorian DPI (2007), fodder value should be based on the cost per unit of energy (metabolizable energy ME) rather than the cost per tonne of feed. A 450 kg cow with a calf up to 4 months old will need to eat 85 MJ per day, and can eat around 10 kg of dry matter (2.2% of body weight). This means she will require a minimum ME of 8.4 MJ/kg feed and 10% protein. A 300 kg steer growing at 1 kg/ha per day will need 76 MJ/day, and can eat only 7.6 kg DM per day so that the ME content of the hay should be at least 10 MJ/kg and 13% protein.
While the application of P reduced ME content by around 10%, the energy content was still adequate for most classes of beef cattle. The total yields of both energy and protein rose significantly as more P was added. For example, the 9 kg P/ha rate increased the yield of protein and energy by 60%.
Like phosphorus, applied nitrogen had a significant effect on the quality of fodder produced and increased crude protein content from 8.4% (nil N) to 13.1% (80N). Balancing N and P meant that the yield gains due to the added P also maintained quality by keeping N supply up.
The nil effect of applied N on hay yields was surprising, as there was only 26 kg N/ha in the top 60 cm at sowing on the nil N plots. Plots that had received 80 kg N/ha over the past 16 years had a little more (36 kg N/ha) but would still be expected to respond to added N. However, on the high N plots, there was an extra 70 kg N/ha in the 60 to 150 cm depths, which was expected to be a remnant of the previous applications, leached down with the past two relatively wet years in the Wimmera. It may be that with the relatively small plots, the N under the past high rates is available to any adjacent lower N plots as the roots move deep into the soil in wetter years.
Figure 2 Dahlen oaten hay response to added N, 2011.
Reference
Victorian DPI (2007), Drought: A guide for farmers and land managers (March 2007). http://www.dpi.vic.gov.au/agriculture