04 Sep 2013
Warra Site - 2012/13 Cotton Results
Managing K in Northern Cropping Systems

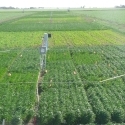
Warra site, 2012
This site was sown to cotton in summer, 2012. No additional nutrient (other than N) has been applied to assess the residual response of the crop to deep placed K, P and S. The crop was grown under irrigation, and after removal of a 13 bale cotton crop in 2012, was expected to be responsive to applied K.
The data on K accumulation from the 2011/12 crop season is now available, along with that from early season samples (at first flower) collected from a subset of treatments in 2012/13. The maximum biomass data and crop yields in both seasons, and the K accumulation data from 2011/12, are shown in Table 1. The early biomass sample collected at flowering in 2012/13 compared the Control (no K applied) treatment with the combined (Shallow + Deep K), 50cm band spacings treatment, as an indicator of K availability when the root system was less well developed. This sampling showed slightly higher biomass with applied K (5315 kg/ha v 4930 kg/ha; not statistically significant), higher biomass K concentrations (2.01% K v 1.81% K; P<0.01) and higher K uptake (106 kg K/ha v 89 kg K/ha; P<0.07). This provided some indication that, unlike 2011/12, the crop was accessing the residual K fertiliser (now dispersed by tillage during the fallow between crop seasons).
Table 1. Biomass production, crop K uptake and raw cotton yields in response to K application strategies for crops grown in the 2011/12 and 2012/13 growing seasons at South Wyobie. All K treatments received basal applications of P and S prior to the 2011/12 season.
2011/12 | 2012/13 | |||||||
| Treatment | DM (kg/ha) | K (%) | K-uptake (kg/ha) | Raw cotton yield (t/ha) | DM (kg/ha) | K (%) | K-uptake (kg/ha) | Raw cotton yield (t/ha) |
| Farmer ref | 5.91 | NA | ||||||
| Control (PS) | 15703 | 1.35 | 212 | 6.03 | 14710 | NA | NA | 6.69 |
| Shallow K 25cm | 15473 | 6.03 | 13817 | NA | NA | 6.95 | ||
| Shallow K 50cm | 6.22 | 7.07 | ||||||
| Shallow K 100cm | 15897 | 6.07 | 14452 | NA | NA | 7.17 | ||
| Deep K 25cm | 18029 | 1.29 | 242 | 6.15 | 14933 | NA | NA | 6.89 |
| Deep K 50cm | 6.08 | 6.91 | ||||||
| Deep K 100cm | 15229 | 1.33 | 208 | 6.28 | 15165 | NA | NA | 6.66 |
| Shall+Deep K 25cm | 15801 | 1.38 | 220 | 6.14 | 15365 | NA | NA | 6.67 |
| Shall+Deep K 50cm | 6.04 | 6.73 | ||||||
| Shall+Deep K 100cm | 15508 | 1.31 | 203 | 6.19 | 14195 | NA | NA | 6.94 |
| Surface applied & incorporated K | 15538 | 1.49 | 227 | 6.22 | 14519 | NA | NA | 6.91 |
| Average all K applications | 15925 | 1.36 | 220 | 6.14 | 14778 | 6.89 | ||
| KUE (kg K/t raw cotton) | Control = 35.1 Av K applied = 35.8 | NA | ||||||
| LSD (P<0.05) | ns | ns | ns | ns | ns | NA | NA | ns |
Unfortunately there were no significant impacts on K uptake, crop growth or yield in either crop season, despite low soil test K in the field and a history of occasional premature senescence. While there was evidence that the crop did acquire some residual K fertiliser in 2012/13, at least early in the season, there was no evidence of an impact on biomass production or yield. The calculated KUE’s for the 2011/12 crop suggest this site was able to supply more than adequate K to meet crop demands of what were high yielding crops. The benchmark value derived from long term K trial sites on Ferrosols suggests values of KUE above 19-20 kg K accumulated in biomass for each tonne of raw cotton were indicative of a crop with adequate K supply. Clearly the soils at this site had a high enough K status to meet and exceed that K demand in the seasonal conditions experienced in 2011/12, and given the lack of yield response, presumably in 2012/13.


