28 Feb 2013
Capella site - 2012 chickpea results
Managing K in northern cropping systems
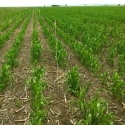
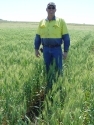
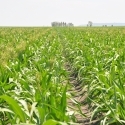
 Chickpea crop
Capella Site - Chickpea results 2012
This site was sown to chickpea in May 2012, over the base treatments laid down earlier in the year.
The growth and yield of chickpea at this site shows a clear and strong response to P and there was an extra response in growth to added K once the P demand was met, although unfortunately this did not translate into a significant increase in grain yield. There was no response to S, alone or in combination with P and/or K.
These data clearly show that the primary nutrient limitation at this site was P, and until this deficit was overcome, responses to other nutrients (particularly K) could not be expressed. The application of P, alone or in combination with other nutrients, increased P uptake by 60-70%, and as seen in other sites, resulted in greater access to native K in the soil profile (i.e. 15-20% greater K uptake). Interestingly, this effect of P on K uptake was equivalent to the application of K fertiliser (alone or with S). However, the combination of P and K resulted in the highest P and K concentrations and uptake in biomass, with crop K uptake >70% higher than in the Control and Farmer Reference treatments.
The additional uptake of K by the crop was small relative to the high rates of K addition (200 kg K/ha), and at least partly reflect the strong buffering of soil solution K in these high CEC clay soils. The traditional luxury uptake of K by crops when soil K is adequate is increasingly muted as CEC and K buffer capacity increases and in extreme cases very high rates of K addition are necessary to achieve significant increases in crop K uptake. However, this characteristic also facilitates the use of these occasional, high rate applications of K deeper in the soil profile, as the deep K will be depleted less rapidly (and often relocated back on the soil surface in crop residues), so there will be sufficient residual K in those deeper layers to supply multiple crops without further profile disturbance. As noted, minimal disturbance in these zero tillage, stubble retention rainfed cropping systems is a key management factor in efficient capture and use of available moisture.
As has also been observed in other trials, there were minimal effects of K application on grain K content, with concentrations ranging from 0.84% with no added K, to 0.87% with added P or K alone and 0.91% when P and K were added in combination. The resulting K removal rates in harvested grain were therefore dominated by grain yields, ranging from 19.9 kg/ha with no added K, 20.9 kg/ha with K alone, 24.4 kg with P alone and 25.9 kg/ha with P and K together. This represents approximate K harvest indices of 30-35% for all except the combined PK and PKS treatments, where the greater K uptake but limited yield increase resulted in KHI of 25%.
In terms of nutrient uptake, there was no evidence of any response to added S, in concentration or uptake. Higher S uptake occurs when P, and to a lesser extent P and K, are added. Once both P and K are adequate, there seems to be some response to S in terms of %S in DM, but it is small. Similar trends were obvious in grain, with no significant increase in grain S unless P was adequate (i.e. 1533 – 1567 mg/kg for Control and S only treatments, cf. 1633 mg/kg with P or P and K. This is surprising, considering the low profile S (1 site excepted) and low organic matter status of the site.
- Table 1. Chickpea growth, yield and nutrient uptake at Capella, 2012.
| Treatment | DM | Grain yield | %P | P-uptake (kg/ha) | %K | K-uptake (kg/ha) | S (mg/kg) | S-uptake (kg/ha) |
| Farmer ref | 4710 | * | 0.13 | 6.0 | 1.25 | 58.7 | 1048 | 4.9 |
| Ctrl | 4979 | 2317 | 0.12 | 6.1 | 1.16 | 58.1 | 965 | 4.8 |
| Ctrl +TE | 5056 | 2388 | 0.12 | 6.2 | 1.15 | 58.3 | 1005 | 5.1 |
| S | 4913 | 2357 | 0.12 | 5.9 | 1.15 | 56.5 | 1011 | 5.0 |
| K | 5019 | 2386 | 0.12 | 5.9 | 1.38 | 69.1 | 977 | 4.9 |
| K:S | 5243 | 2348 | 0.11 | 5.6 | 1.29 | 67.6 | 923 | 4.8 |
| P | 5957 | 2782 | 0.15 | 9.1 | 1.14 | 68.0 | 1037 | 6.2 |
| P:S | 5913 | 2806 | 0.15 | 8.7 | 1.11 | 65.6 | 1029 | 6.1 |
| P:K | 6755 | 2894 | 0.15 | 10.0 | 1.52 | 102.8 | 1009 | 6.8 |
| P:K:S | 6886 | 2808 | 0.16 | 10.7 | 1.51 | 104.1 | 1089 | 7.5 |
| P:K:S +TE | 6555 | 2825 | 0.16 | 10.4 | 1.54 | 100.4 | 1111 | 7.3 |
| LSD (P<0.05) | 547 | 138 | 0.02 | 1.3 | 0.11 | 9.6 | 82 | 0.8 |
Soil details at site
| Analyte | 0-10 | 10-30 | 30-60 |
| pH (water | 7.3 | 8.2 | 8.4 |
| EC SE | 0.7 | 0.9 | |
| Cl (mg/kg) | <10 | <10 | <10 |
| Nitrate N mg/kg | 0.7 | 0.6 | 0.7 |
| Ammonium N mg/kg | 2.5 | 2.9 | 2.8 |
| Colwell P mg/kg | 9 | 7 | <5 |
| PBI | 135 | 157 | 157 |
| BSES P mg/kg | 13 | 9 | 6 |
| Avail K mg/kg | 142 | 34 | 30 |
| Ex-K cmol/kg | 0.37 | 0.09 | 0.08 |
| S KCl-40 mg/kg | 2.8 | 1.5 | 1.5 |
| Organic C% | 0.65 | 0.55 |
The site will be sown to wheat in 2013.