12 Dec 2012
Trends and surprises
Outcomes from the long term trial
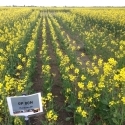
 Dahlen Long Term Fertilizer Experiment, 2010, nil p versus 18 kg/ha P in canola
Building soil test P takes a long time. Based on these data, Colwell rises 0.2 mg/kg for each kg P over the P balance. This is an interesting figure, as it gives us an idea of the rate of P fixation in these soils. For each kg of P over balance (~0.9 mg/kg) 0.2 shows up in Colwell, but the rest 0.7 mg/kg does not show up. So the soil fixes about 0.7 kg P per excess P in non-Colwell pools. So if we put on 5 kg extra of P, the Colwell would rise 1 mg/kg and the rest would go into non-labile pools.
Surprises?
Lack of N response in a couple of years – including in the hay crop – the legume before the oats and the build up of N generally – seems to have been adequate to meet the demands of this crop – which should be a great sucker of nutrients. Strong response even at 18 kg P (which is actually 72 mg/kg colwell P).
For the N responses:
- - 0 N (75 kg N offtake) – 25 kg N top 60 + 30 kg pot min N
- 80 N (120 kg N offtake) 37 kg N top 60 + 50 kg pot min N + 80 applied
Nutrient Offtakes:
- - P inputs and (offtakes) per year– 0 (5.2), 9 (9.4), 18 (12.9), 36 (17.4)
- N inputs and (offtakes) per year– 0 (75), 20 (88), 40 (96), 80 (121), 160 (132)
No K inputs - so what was the K off-take = 27 kg K/t compared to eg wheat @ 4.6 kg K/t
What are the other nutrients – are they running out?
No S or Zn added in the past couple of years – are seeing some Zn problems emerging – Oaten Hay – N increased Zn content, P decreased Zn content (same for S). Same trend seen in canola – although the decline in Zn was less than in the oaten hay – high P reduced grain Zn from 35 to 32 – significant but not important. For the tissues samples taken earlier – see the same trend in wheat but even more marked – 0P=31 mg/kg, 9P=21; 18P=20; 36P=16. Difficult to interpret but it is probably Zn responsive at those tissue levels (<20). Canola grain S levels low but N:S ratio in grain came out OK (7) suggesting that deeper S was available to the crop.
Additional Resources
Summary Paper of Long Term EffectsSize: 0.48 MB