12 Dec 2012
Dahlen Long Term Experiment
Outline of the experiment
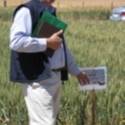
 Sowing the long term N*P experiment
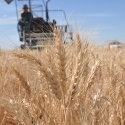
The Dahlen long term nutrition experiment, 10 km west of Horsham, was established in 1996 to investigate
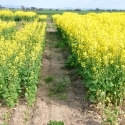
the interaction of different rates of N and P within a modern cropping system. Since establishment, the site
has been in a canola, wheat, barley, pulse rotation. The soil at the site is a vertisol. The fertilizer treatments
imposed are five rates of nitrogen (0, 20, 40, 80, 160 kg as urea) and four rates of phosphorus (0, 9, 18, 36 kg
as triple super) applied annually over the past 17 years. No N is applied during the pulse phase of the
rotation. Prior to 2011, there were two series of N treatments, either all N at sowing or split 50:50 between
sowing and stem elongation.
The site has been direct drilled and stubbles retained except in 2000 when the site was burned. Grain samples
were taken at harvest and yields are adjusted to 10% (cereals and pulses) or 8% moisture contents (canola).
Grain N content was assessed using NIR on the whole grain in each year. Grain P content was measured for
wheat and canola in 2009 and 2010, but default values for wheat (0.26%), canola (0.51%) barley (0.27%),
chickpea (0.33%) and lentil (0.33%) (National Land and Water Resources Audit 2001) N and P removals
were used to estimate nutrient removal (product of grain nutrient content and yield) when constructing
nutrient balances for the period 1996 to 2010. Fertilizer P was applied in all years including for failed crops,
but there was no N topdressed on the failed crops. No N was applied to the pulse crops, and in 2005, the
natural abundance method was used to assess the amount of N derived from the atmosphere on in relation to
peak biomass (Ndfa). Biomass for pulse crops was estimated as 3 times the grain yield, and Ndff as the
product of the biomass by 25 kg N/ha/t (Peoples et al. 2001). P rate did not affect the rate of N fixation per
unit biomass in 2005.
In 2011, the whole site (120 plots) was sampled in the top 10 cm for Colwell P, mineral N, total soil N, C
and P. In addition, the 0N:0P, 0N:18P, 80N:0P, 80N:18P, 160N:0P and 160N:18P treatments were sampled
for mineral N to 150 cm. Soil tests were also available from prior to the first crop in 1996. These data were
analysed using a factorial analysis of variance with four rates of P and 5 rates of N combined. For this paper,
data from the 0N:0P, 0N:18P, 80N:0P, 80N:18P, 160N:0P and 160N:18P treatments are presented.
Additional Resources
Summary FileSize: 2.44 MB