18 Sep 2014
IPF Dahlen Long Term Fertilizer Experiment - 2014
What are we seeing 18 years on?
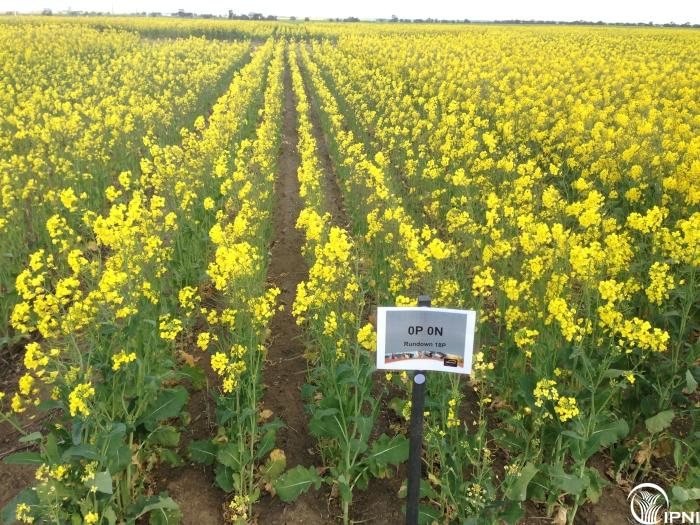
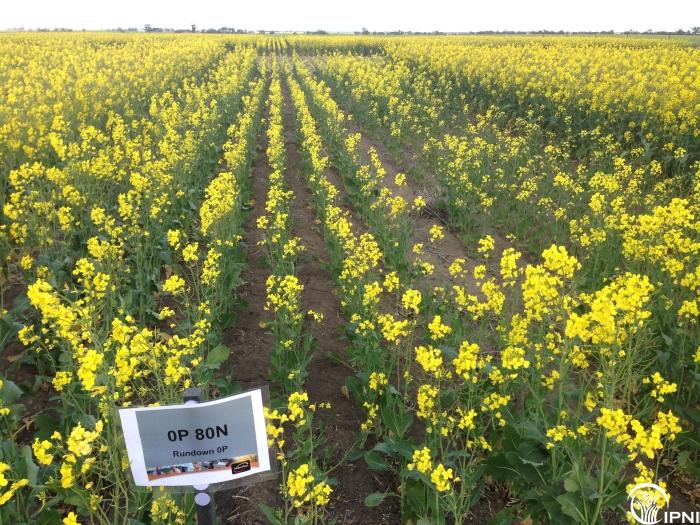
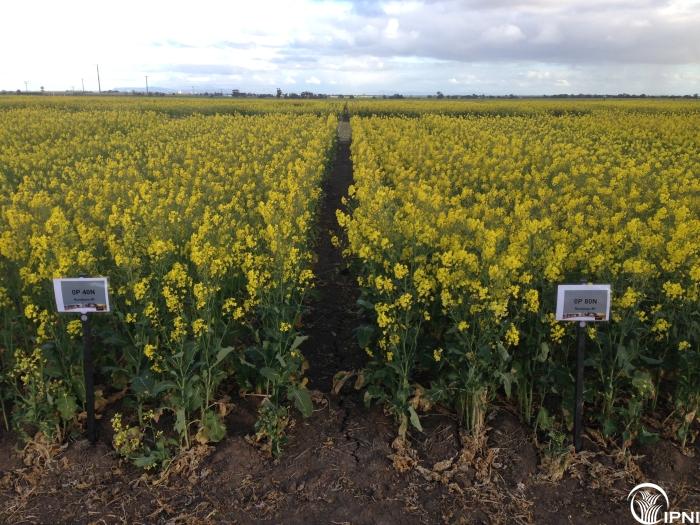
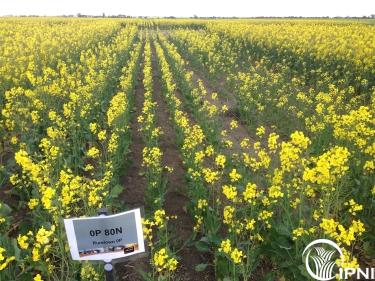 0 P & 80 N
The Dahlen nutrition experiment was established by Incitec Pivot Fertilizers in 1996 and is investigating the interaction of different rates of N and P within a modern cropping system (stubble retain, no-till) on a Vertisol. Since establishment, the site has been in a canola, wheat, barley, pulse rotation (with oaten hay in 2011). Nitrogen (0, 20, 40, 80, 160 kg as urea) and phosphorus (0, 9, 18, 36 kg as triple super) have been applied annually over the past 19 years. No N is applied during the pulse phase of the rotation. Prior to 2011, there were two series of N treatments, either all N at sowing or split 50:50 between sowing and stem elongation, but now all the N treatments are applied at seeding, and what were the split N treatments now receive no P. This is to see how quickly the drawdown on P will occur from what are now very high soil P levels. IPNI has been collaborating with Incitec Pivot on this project since soon after it started.
This years soil tests from the Nutrient Advantage laboratory show no significant difference between the continued P and terminated P Colwell P soil test values. Other soil tests are:
N rate kgN/ha/y | P rate kgP/ha/y | Colwell P mg/kg (10cm) | OC% (10cm) | Mineral N mg/kg (10cm) |
40 | 0 | 15 | 1.047 | 8.1 |
40 | 9 | 34 | 1.633 | 7.6 |
40 | 18 | 67 | 1.200 | 6.8 |
40 | 36 | 108 | 1.200 | 8.5 |
Key Points from the IPF Dahlen
· The best rate for productivity was also the best rate for improving organic carbon.
· The 9P rate is in approximate P balance with an excess of application over removal of around 3 kg/ha P per year. This surplus has seen soil test P values increase by approximately 1 mg/kg per year.
· The 40N rate is in approximate N balance, with an excess of application (plus fixed N) over removal of around somewhat less than 2 kg N/ha per year. This balance of N and P shows that nitrogen use efficiencies in long term experiments can approach 100%
· Long term partial nutrient balances were nearing unity for the 80N:9P treatment.
· The set fertiliser strategy for 9 kg P/ha & 20 kg N/ha developed during the period 2000-2009 appears to be somewhat N limited in the past 4 (better) seasons.
· A small yield decrease was seen – even at high soil test P – when no P was provided at seeding.
· Long term trends in nutrient balance indicate that 40 kg N and 9 kg P will be in about nutrient balance, and these rates are supported by soil test changes.
· Current N status 10-90 cm for 9P treatments 0N=58 kgN; 20N=52 kgN; 40N=68kgN; 80N=247kgN; 160N=447kgN – most of the N applied is still there – although maybe not recoverable.
· High N rates have lowered the soil pH – impact of nitrate leaching.
· See http://anz.ipni.net/topic/dahlen-long-term-fertilizer-experiment for more information.
A summary of the yields, N balance, P balance for the period 1996 to 2013, and soil organic C and Colwell P values from soil samples taken in 2011 from the Incitec Pivot Fertilizers Long Term N*P experiment.
N kg/ha/y | P kg/ha/y | Mean Yield (t/ha) | N Balance (kg/ha) | P Balance (kg/ha) | OC% | Colwell P |
0 | 0 | 1.61 | -324 | -76 | 1.08 | 18 |
9 | 1.95 | -311 | 65 | 1.18 | 41 | |
18 | 2.10 | -387 | 208 | 1.23 | 72 | |
36 | 2.10 | -361 | 515 | 1.22 | 128 | |
20 | 0 | 1.69 | -119 | -84 | 1.10 | 17 |
9 | 2.30 | -181 | 51 | 1.23 | 41 | |
18 | 2.35 | -154 | 186 | 1.32 | 77 | |
36 | 2.30 | -236 | 483 | 1.30 | 122 | |
40 | 0 | 1.81 | 97 | -109 | 1.07 | 16 |
9 | 2.31 | -20 | 41 | 1.28 | 39 | |
18 | 2.46 | -28 | 192 | 1.40 | 70 | |
36 | 2.49 | 11 | 481 | 1.32 | 118 | |
80 | 0 | 1.75 | 578 | -114 | 1.10 | 17 |
9 | 2.46 | 405 | 24 | 1.23 | 38 | |
18 | 2.67 | 431 | 181 | 1.37 | 64 | |
36 | 2.58 | 383 | 493 | 1.32 | 124 | |
160 | 0 | 1.78 | 1651 | -106 | 1.10 | 19 |
9 | 2.35 | 1493 | 29 | 1.32 | 46 | |
18 | 2.46 | 1454 | 175 | 1.33 | 77 | |
36 | 2.56 | 1389 | 477 | 1.30 | 132 |


