12 Dec 2012
Crop Yields at Dahlen
Crop yields and main effects, 1996-2010
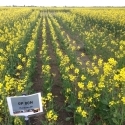
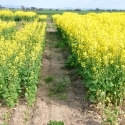
 Harvesting the long term N*P experiment
The table below shows the mean yields for each of the 14 years when crops were harvested. In all but one year, N (2005) and P (2008) treatments resulted in significant yield responses. There were interactions between N and P in over half the years, but this tended to be because of no response to N when P was not applied rather
than a synergy of responses at higher rates. The timing of N application resulted in significant effects on yield in 5 of the years, but this effect was weak in the more recent years of the experiment.
N and P interaction does occur – at the higher N rates, Colwell P is less that at the lower N rates – probably because there is less P offtake at the lower/lowest N rates. In terms of yield interaction, for wheat in only one of three years there were significant interactions – the nature of that interaction was that there was little N response when there was no P applied (not unexpected).
Timing of N is a less important aspect than many would suggest – for the non-legumes, there were only 3 of 11 years where splitting was significantly different to up-front – in 1996 for barley (upfront better) and in 2010 with canola ( split better). For all the others there were no significant differences – there were differences in lentils with splitting but that is not that important really – as no N was applied in those years and this is a residual effect
Table Mean site yields (t/ha) and the level of significance of the yield response to N, P, fertilizer timing (T) and
the interaction of N and P.
| Year | 1996 | ‘97 | ‘98 | ‘99 | ‘00 | ‘01 | ‘03 | ‘04 | ‘05 | ‘07 | ‘08 | ‘09 | ‘10 |
| Crop | Barl | Cpea | Cano | Whea | Barl | Lent | Whea | Barl | Lent | Whea | Barl | Cpea | Cano |
| Site Mean Yield (t/ha) | 3.26 | 1.62 | 1.32 | 1.84 | 3.05 | 0.90 | 3.69 | 1.00 | 1.03 | 2.25 | 1.10 | 0.51 | 2.54 |
| N | *** | *** | *** | *** | *** | *** | *** | *** | ns | ** | *** | *** | *** |
| P | *** | *** | *** | *** | *** | *** | *** | *** | *** | ** | ns | *** | *** |
| T | *** | ns | *** | ns | *** | ns | ns | ns | ** | ns | ns | ns | * |
| N*P | *** | ns | *** | ns | *** | *** | *** | *** | ns | ns | *** | ns | ns |
Additional Resources
Summary FileSize: 2.44 MB


