25 Aug 2014
Micronutrients Copper and Manganese
Their role, requirements and options
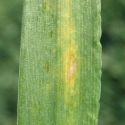
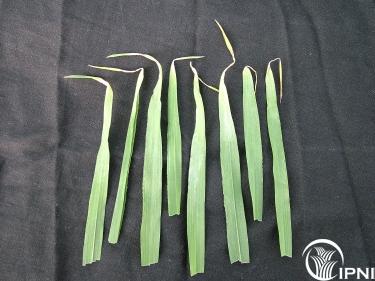 Copper deficiency (S. Moroni, CSU)
Most growers and agronomists are fully aware of the nitrogen and phosphorus demands of crops, and meeting those demands is a major investment in crop production. Sulfur and potassium are also important in some regions as have calcium and magnesium. These six nutrients – the macronutrients – are complemented by a set of nutrients required in smaller amounts – the micronutrients or trace elements. Even though needed in small quantities, Copper (Cu), Manganese (Mn), Iron (Fe), Zinc (Zn), Boron (B) and Molybdenum (Mo) are all essential for plant growth, although the demand is small relative to nitrogen and phosphorus.
South Australia has a long and proud history of micronutrient research, and in the early 1960’s it was found that foliar sprays of Mn onto barley gave a 20 fold responses in the southern Yorke Pennisula. This was the first time foliar trace elements had been applied to agricultural crops in Australia. Similarly, with copper, South Australian scientists have led the way with diagnosis and remediation, as well as developing a deep understanding of cultivar differences in copper (and manganese) responses.
Even so, between farms and within farms, the response to micronutrients will differ. In this paper, the discussion is particularly around copper and manganese, but growers – especially those on alkaline and calcareous soils should not forget about zinc. With that in mind, the diagnosis situations where responses will occur is a critical issue, and that assessment requires information about the nutrient stores available for redistribution within the plant, the supply of nutrient from the soil and the nutrient requirement for growth and yield. This discussion aims to review these issues relative to copper and manganese.
Diagnosis of the RIGHT problem
Just because the macro nutrient demands are met does not always mean that the next limit on yield is on one of the micronutrients. Moisture is still a limit in most situations and if growers are to invest in micronutrients then correct diagnosis and treatment is critical – and the 4R’s (Right Source, Right Rate, Right Time, Right Place) concept applies, and these four aspects need to be addressed. Micronutrients work with macronutrients but are not substitutes for them nor will they give responses unless they are a limiting factor.
Soil testing
Soil tests are often the starting point for assessing potential response to micronutrients, and Table 1 shows a summary of DTPA extractable soil test values for various regions within South Australia. The values for Cu and Mn in the mid-North and the Lower-EP show huge variation, indicating that in some cases test values are low to very low. Soil test critical values are not that reliable for micronutrients in general and Mn in particular, as soil test value can change significantly with water logging in particular. So, treat the critical values in Table 1 with caution.
Soil tests for micronutrients generally have a lower reliability than soil tests for the macronutrients. As well as the uncertainties associated with seasonal conditions, rooting depth and nutrient demand, micronutrient availability is often derived from a number of soil pools that may not necessarily be extracted in the soil tests. Soil organic matter, texture and soil pH are all moderating influences on nutrient availability and often need to be considered in association with the soil test values measured. The difficulty with assessing the availability of metal cations (like Cu, Zn, Mn and Fe) is affected by redox state as well as the formation of metallo-organic ligand complexes and they can also precipitate (usually as hydroxides) depending on concentration and pH. Manganese becomes less available at high soil pH. Copper is also quite reactive and it can bind with organic matter and its availability declines with high pH.
Table 1. DTPA zinc, DTPA copper, DTPA manganese, soil pH and hot water extractable B values (top 10 cm) for regions within South Australia (NVT Sites).
| Region | pH (CaCl2) | HWS B (mg kg-1) | DTPA Cu (mg kg-1) | DTPA Mn (mg kg-1) | DTPA Zn (mg kg-1) |
| Lower EP | 7.1±0.1 | 5.6±0.8 | 1.9±1.0 | 14.8±54.2 | 3.9±3.8 |
| Mid North | 6.9±0.1 | 2.7±0.7 | 0.5±1.0 | 1.1±54.3 | 0.3±3.8 |
| Murray Mallee | 7.4±0.2 | 2.3±1.3 | - | - | - |
| South East | 7.1±0.1 | 3.1±0.6 | 0.8±0.1 | 1.7±7.0 | 0.9±0.5 |
| Upper EP | 7.7±0.1 | 5.1±0.8 | - | - | - |
| Yorke P | 7.4±0.1 | 3.7±0.7 | - | - | - |
| Critical Values* | <0.12 | <0.2-0.3 | <10 | <0.8(?) | |
| All zones | 6.3±1.3 | 3.5±13.3 | 1.1±1.0 | 24±43 | 1.0±2.9 |
Table 2 shows the results of a survey of wheat grain nutrient contents taken from the NVT sites in 2009 from South Australia. This shows the likely removal of these micronutrients, as well as showing the sorts of variation within and between regions. Like soil test critical values, grain nutrient concentrations are indicators of status, but are not reliable.
Table 2. Wheat grain nutrient concentrations (Norton, 2011) and critical nutrient concentrations for NVT sites in South Australia (Reuter and Robinson, 1997).
| Region | Site Years | B mg kg-1 | Cu mg kg-1 | Mn mg kg-1 | Zn mg kg-1 |
| SA Lower EP | 6 | 2.3±0.3 | 4.4±0.3 | 25.3±3.0 | 18.7±2.0 |
| SA Mid North | 7 | 1.3±0.3 | 5.6±0.3 | 51.1±2.7 | 25.4±1.8 |
| SA Murray Mallee | 9 | 1.9±0.2 | 5.2±0.2 | 38.9±2.4 | 19.2±1.6 |
| SA South East | 5 | 1.5±0.3 | 3.5±0.3 | 26.8±3.2 | 24.5±2.2 |
| SA Upper EP | 12 | 2.4±0.2 | 4.9±0.2 | 49.3±2.1 | 26.0±1.4 |
| SA Yorke Penn. | 6 | 1.8±0.3 | 5.6±0.3 | 41.8±3.0 | 22.2±2.0 |
| Critical Value | 1.0 | 1.5 | 10 | 15 | |
| Mean (SEAustralia) | 2.2±1.3 | 4.8±1.2 | 43.5±13.8 | 23.0±7.3 |
Soil tests have been correlated to crop responses in properly conducted trials, the trials have been limited and the confidence limits can be quite large. This then reflects on the critical levels developed, which are often very low in absolute terms and sampling errors and analytical reliability make them difficult to confidently apply (Table 3). For example zinc critical soil test value is 0.75 mg/kg and while this can be accurately measured, the critical values are at the lower levels of confidence for predicting responses. As with all soil testing, it is important to use accredited laboratories that use ASPAC accredited methods for assessing nutrients – these tests are ones that have critical values established for Australian conditions. There are no Australian data for soil test calibrations for Mn status. For all tests, often soil pH, organic C levels and clay contents may need to be included to make an assessment of the likelihood of deficiencies from a soil test (Table 4).
Table 3. Soil test critical values and interpretive comments . Data taken from Peverill, Sparrow & Reuter (1999) and Rayment & Lyons (2011). Soil report are values from commercial soil testing labs.
| Micronutrient | Crop | Extractant (R&H Method) | Critical Value | How assessed | Region |
| Cu | Barley | AmmOxalate | 0.3 | 90% of RY* | WA |
| Lupin | AmmOxalate | 0.23 | 90% of RY | WA | |
| Canola | AmmOxalate | 0.35 | Non limiting | WA | |
DTPA (12C2) | 0.2 | Non limiting | WA | ||
| Wheat | AmmOxalate | >0.9 | - | WA | |
DTPA (12C2) | 0.2-0.3 | Probability | WA | ||
DTPA (12C2) | <0.2 | 90% RY | SA | ||
DTPA (12C2) | <1.4/0.7 | - | SA N higher | ||
DTPA (12C2) | <0.2 | - | SA | ||
DTPA (12C2) | 0.3 (poor) | C/N | Qld | ||
| Soil Report | DTPA (12C2) | 1-5 | - | ||
| Mn | Barley | CaCl2 (12C) | <10 | Non-limiting | Vic |
| Canola | CaCl2 (12C) | >20? | Acid Soil | Pots | |
| Barley | CaCl2 (12C) | <10 | Non-limiting | Vic | |
| Wheat | CaCl2 (12C) | <10 | Non-limiting | Vic | |
| Lupin | DTPA (12C2) | 2-4 | Lower in sands | WA |
Table 4. A summary of soil and climatic factors affecting micronutrient availability.
B | Cu | Mn | Mo | Zn | |
| pH > 7.5 | +++ | --- | -- | ++ | --- |
| pH < 5.5 | -- | ++ | +++ | -- | + |
| Sand content | -- | --- | -- | - | --- |
| High organic C content | ++ | --- | ++ | - | ++ |
| high P content | - | - | - | +++ | --- |
| water-logged soil | + | ++ | + | ||
| drought | --- | --- | --- | -- | - |
| compaction | + | + | + | + | + |
Tissue Testing
Testing plant tissue for the concentration of nutrient relies on a known relationship between the tissue in question and the degree of limitation that concentration places on crop performance (yield). These relationships are developed between tissues that have consistent responses and at time when nutrient supply is likely to be most limiting. For example, sampling old leaves for N is likely to be of little value as N is mobile and rapidly moved to areas of demand. Figure 1 gives a general view of the types of tissues to sample for nutrient assessment.
A difficulty with interpreting tissue concentrations is that there are at least four relationships seen between yield and nutrient concentration. Another major caution with tissue testing is that when the plant samples are taken, other reserves (eg deeper in the soil) may not yet be accessed and so that a false low tissue content can result. In 2011, there were several reports of low tissue B in canola, but few responses were seen to added B because the crop eventually accessed subsoil B and so solved its own problem.
Figure 1. Tissues to sample for nutrient testing, symptoms occur in the older leaves first with mobile nutrients and the younger leaves first with less mobile nutrients (Price 2006).
Use the right source, rate, time and place.
Micronutrients can be applied either as supplements to macronutrient fertilizers and/or as in-crop treatments. Because of the potential for soil reactions reducing nutrient availability, it may be necessary to protect the micronutrients such as by the use of chelating agents such as EDTA. There have been some new chelating agents developed (Stacey et al. 2008) that can enhance Zn and Cu uptake, particularly on alkaline soils. There have been several product comparisons, such as for copper (Brennan 1990), zinc (Brennan and Bolland 2006) and manganese (Brennan 1996) and these should be considered when selecting an appropriate product as well as referring to some general texts such as Price (2006).
The use of foliar micronutrient is useful when root uptake is reduced and a rapid response is required. The disadvantages of foliar application are that there is little residual activity and to avoid foliar damage only low concentrations can be used. Uptake is limited because only small quantities can be taken up through the stomata, leaf cuticles or parts of the epidermis, but if the nutrient (such as copper) is rapidly fixed in soils, it may an effective strategy. While there is also considerable interest in the use of adjuvants and other materials to enhance micronutrient uptake and effectiveness, there is little evidence in the literature.
Copper:
Occurrence
- · Coastal and inland calcareous soils of marine origin.
· Acid weathered soils derived from granites and sandstones.
· Calcareous and siliceous sands of southeastern SA and western Victoria.
· Organic soils and sandy low organic matter soils deficiency common, as well as where there is high Fe, Mn or Al in the soil.
· Often occur with Zn deficiencies and areas with potential Mn deficiency.
- · Essential for chlorophyll formation and pollen production as well as baking quality.
· Wheat and barley are more responsive to copper than lucerne and canola. There have been very few reports of copper responses to canola.
· Symptoms are rolling and curling of new leaves, white tipped leaf and poor seed set. Symptoms tend to be non-specific and can be confused with tipping due to cold or heat damage.
· Severe deficiency results in “rats-tail” heads with little grain fill.
· Lack of pigmentation in colored sheep and paling of coats in cattle.
- · Critical soil test DTPA extractable Cu is around 0.12 and has moderate to poor reliability.
· Critical tissue levels reported as <1.5 mg/kg youngest expanded blade in wheat (Brennan et al. 1986).
· Grain Cu concentrations are most often >0.2 mg/kg.
- · Cu can be applied as an additive to fertilizers and smaller particles tend to be more effective because of higher chance of root interception. Most effective is through mixing.
· Fluid copper applied in furrow has promise although most of the work done uses multi-nutrient sources.
· Foliar as copper sulfate, copper oxychloride or chelated copper. Chelate Cu resulted in the highest yield per unit of Cu applied, and the gap was larger the later the application.
· Yield response is higher when Cu is applied earlier (6 leaf) rather than later. Earlier application is also less likely to cause canopy damage especially with copper sulfate when applied on warm sunny days.
· Late applications (>ear emergence) may be ineffective.
· Long to very long residual availability (>5 years) when soil applied.
· Copper seed treatments are insufficient to meet plant requirements for the current season.
Occurrence
- · Calcareous soils of the Eyre and York Peninsula – soils >80% calcium carbonate.
· Calcareous (alkaline) and acidic sandy (low inherent levels) soils of Western Australia.
· Gravels in an area South of Moora to Katanning and east from Corrigin to Dumbleyung in WA.
· Neutral to alkaline soils of the Mallee area [north of Esperance] in WA.
· Victorian northwestern alkaline soils?
· Regions of low Mn often lie within regions of low Zn and Cu in Vic, SA and WA.
· Mainly a problem on high organic matter soils, and those with free lime present or on recently limed soils. It may be toxic at low pH (<5).
- · Common enzyme cofactor for chlorophyll and photosynthesis.
· Plant symptoms in moderate deficiency are non-specific but show as mild wilting especially of younger leaves. Interveinal chlorosis appears and the leaves become yellow, with white or grey flecks at the leaf base. Can look like iron but Mn shows in younger leaves more strongly.
· Oats are generally as sensitive as wheat, canola, peas and beans although there are large differences within wheat and barley. For example, Galleon barley is more susceptible than other varieties. Lupin is more tolerant that cereals, symptoms appear as split seed at harvest. Canola is less susceptible than cereals to deficiency.
- · Critical soil test DTPA extractable Mn is less than 10, and this is a poor soil test with low reliability.
· For cereals, YEB tissue concentrations of less than 12 mg Mn/kg in the youngest mature leaf are considered deficient. For lupin and lentil, the critical values for youngest mature growth are around 20 mg/kg.
· Grain Mn concentrations are most often >10 mg/kg, but this is an unreliable indicator of soil Mn status.
- · High rates (15-30 kg/ha) of banded manganese sulfate at sowing should give a couple of years benefit. Manganese oxide is less soluble and is about half the effectiveness of sulfate. There are no effective Mn chelates commercially available at reasonable cost for use in grain production systems. Soluble Mn silicates are of interest but require evaluation.
· Foliar Mn can be more efficient than soil applied Mn, as the latter can result in iron or phosphate precipitates. Chelated formulations are also available. Generally rates are around 1-5 kg Mn/ha in relatively high water volumes although a “little (<1 kg/ha) and often” approach may be more effective.
· The appropriate timing will depend on the degree of stress, and crops often show good recovery if Mn is applied when symptoms appear and when there is good crop cover. Multiple applications may be needed.
· Annual treatment with foliar Mn is probably more effective than at-sowing application.
· Late Mn applications can increase Mn seed content and improve seed vigor and provides another strategy for reducing the risk of Mn deficiency.
· Short residual availability, meaning treatments may be needed annually.
· Manganese seed treatments are insufficient to meet plant requirements for the current season.
Summary
Trace elements are important and can be limiting factors under certain conditions. Diagnosis of the disorder can be done through a combination of situation, selected crop, soil tests and tissue tests, allied with careful observations. Treatment options are either to use supplemented fertilizers which can give long term increases or the use of foliar sprays to treat growing crops. There are many products on the market, and demand the evidence of their efficacy from properly run experiments.
References:
Brennan R 1990. Aust J. Exp. Agric. 30, 687-691.
Brennan R. 1996. Journal of Plant Nutrition, 19, 293-304.
Brennan R, M Bolland. 2006. 46, 1615-1620.
Brennan R, et al. 1986 Aust. J. Exp. Agric. 37,115-124
Norton R. 2011. http://anz.ipni.net/articles/ANZ0073-EN
Piper CS 1942. J. Agr. Sc. 32, 143-178.
Price G (ed) 2006. Australian Soil Fertility Manual. CSIRO Publishing, Collingwood, Victoria, Australia.
Reuter DJ. JB Robinson, 2005. Plant analysis: an interpretation manual. CSIRO Publishing, Collingwood, Victoria, Australia.
Smith FW, JF Loneragan, 1997, In (Eds). DJ Peverill KI, LA Sparrow, DJ Reuter 1999. Soil analysis: an interpretation manual. CSIRO Publishing, Collingwood, Victoria, Australia.
Shinmachi F, et al. 2010. Plant Physiol. 153, 327-336
Steenbjerg F. 1951. Plant Soil 3, 97-109.
Stacey SP, D Oosterhuis, MJ McLaughlin. 2008. Americas J. Plant Sci. Biotech. 2, 69-73.
Zhu Y-G, SE Smith, FA Smith. 2001 Annals of Botany, 88, 941-945.

Manganese Deficiency

Severe Manganese Deficiency
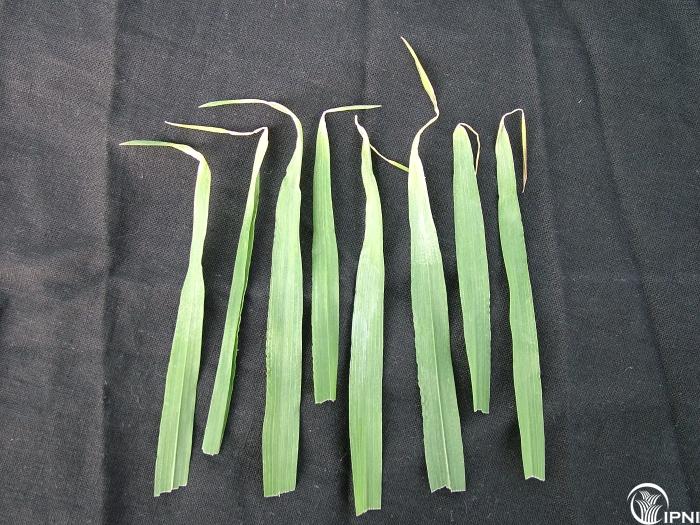
Copper deficiency (from S Moroni, CSU)
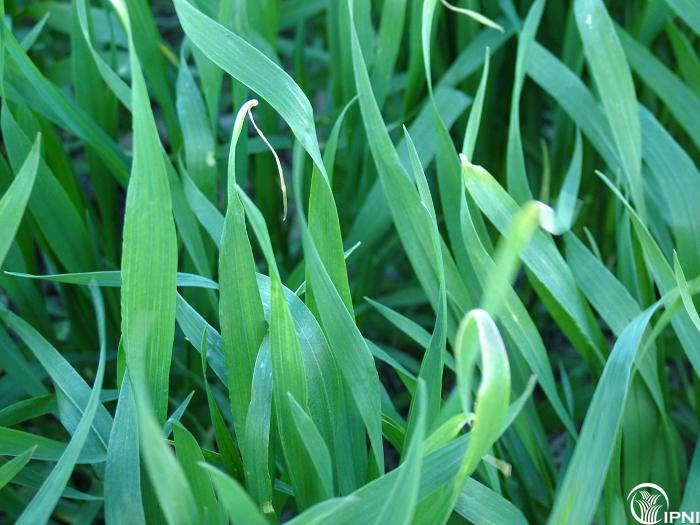
Copper deficiency (from S Moroni, CSU)
Additional Resources
Copper and ManganeseSize: 7.56 MB
PaperSize: 0.18 MB
Nutrifact #9- ManganeseSize: 1.5 MB