10 Mar 2014
To spray or to spread: Quantifying UAN leaf N uptake
Report on a comparison in the Victorian Mallee
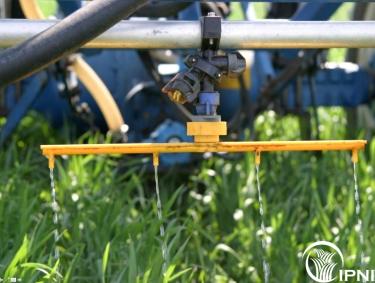 Application of fluid fertilizers
To spray or to spread: Quantifying UAN leaf N uptake
Tim McClelland, (BCG) and Dr Robert Norton (IPNI)
Take home messages
· Urea and UAN were equally effective when applied to the soil. · Growers should select the nitrogen product than most suits their farming system in terms of logistics and cost. |
Background
Fertiliser inputs represent a significant proportion of total variable costs in grain production. A common question that arises in the cropping season is how much nitrogen (N) is lost when fertiliser, particularly urea, is applied and follow-up rain does not occur immediately after application? Growers relate to this because they recognise the link between volatilisation and the effect this has on reducing the amount of nitrogen available to their crop and the consequent ‘waste of money’. One method adopted by growers to reduce the likelihood of volatilisation is to use UAN. There is a perception that a large portion of the nitrogen when applied as UAN is taken up by the crops leaves and that there is a reduced need for follow up rain.
Urea is prone to volatilisation because it is highly reactive with water. For plants to utilise nitrogen from urea it must pass through a two stage reaction.
- 1. The first stage of the process is the conversion of urea [(NH2)2CO], with the addition of water, to ammonium (NH4+) as ammonium carbonate. This is called urea hydrolysis.
2. The ammonium is in plant available form, but depending on conditions, this ammonium can be converted to ammonia (NH3) which is a heavier than air gas or to plant available nitrate (NO3-).
If the soil is dry the second stage of the reaction will not progress leaving the nitrogen in a gas form (ammonia) leaving it susceptible to volatilisation into the atmosphere.
One method adopted by growers to reduce the likelihood of volatilisation from urea is to use UAN liquid fertiliser, a solution of urea (35%) and ammonium nitrate [NH4NO3] (45%). UAN is used to bypass the potential for volatilisation because there is a perception that a large portion of the nitrogen when applied as UAN is taken up through the crops leaves and that there is a reduced need for follow-up rain. This perception is only partially true.
When in the root-zone, both ammonium and nitrate are immediately available to the plant, but when applied to leaves, the urea is taken up 10 times more rapidly than the ionic N forms. Even so, only a relatively small amount is able to taken up without causing leaf damage due to urea toxicity and salt damage. In addition, in some circumstances not all of the liquid fertiliser will make contact with the crop leaves, some may pass through to the soil thus making the actual percentage of N available immediately to the crop smaller than 50%. The density of the crop canopy will have a significant impact on the amount of nitrogen immediately available a crop. In a dense canopy, some ammonia that is produced through the above soil reactions can be absorbed directly by the leaves.
Aim
- To quantify nitrogen leaf uptake when applying UAN.
- To determine if follow-up rain is required when using UAN.
- To determine the effect of streaming vs standard nozzles in Nitrogen leaf uptake?
Method
The field trial was established at the BCG main site at Watchupga East and compared a range of fertiliser application methods and products in order to assess the quantity of leaf uptake from UAN and liquid urea) applied to a wheat crop. Granular fertiliser treatments were applied using garden hand spreaders and liquid fertilisers applied using a hand held 1.5m boom for the streaming nozzle and standard nozzle treatments and a modified hand held boom for the inter-row treatments. All treatments received identical agronomic management with only treatment differences applied. The trial assessments included a measure of greenness (NDVI) prior to treatment applications, total nitrogen percentage and dry matter of biomass cuts of 1 meter of crop row conducted 4 and 10 days after the application and at anthesis and yield and quality parameters. Treatments that had the potential for liquid fertiliser to end up on the leaves (standard nozzle and streaming nozzle treatments) were washed prior to the N % analysis so as to not invalidate the results. The washing ensured no liquid fertiliser remained on the outside of the leaves. No measurements of ground cover were taken in the trial.
Location: Watchupga East
Replicates: four
Sowing date: 15 May 2013
Target plant density: 150 plants/m²
Crop type/s: Correll wheat
Fertiliser: MAP + Zn (55kg/ha)
Herbicides: 15 May TriflurX® (2L/ha), Weedmaster® Duo (2L/ha) & Avadex® Xtra (2L/ha)
9 July Velocity® (670ml/ha), LontrelTM Advanced (50ml/ha) & HastenTM (1%)
Insecticides: 23 September Fastac® Duo
Seeding equipment: BCG cone seeder (knife points, press wheels, 30cm row spacing)
Table 1. Trial treatment products and application methods, dates, rates and growth stages.
Treatment | Follow-up Rain | No Follow-up Rain | ||
Timing | Rate(kg/ha) | Timing | Rate(kg/ha) | |
| Control | GS31 (16-Aug) | 0 | GS32 (29-Aug) | 0 |
| Liquid Urea, standard nozzles | 18 | 18 | ||
| UAN inter-row only | ||||
| UAN standard nozzles | ||||
| UAN streaming nozzles | ||||
| Urea top dressed | ||||
Results and Interpretations
The measure of green cover (NDVI), a surrogate for crop biomass, conducted prior to the treatment applications returned no significant differences between treatments. It can be concluded that all treatments were starting from a similar point and that any differences observed from this point forward are the result of treatment effects. It should be noted that the trial was very nitrogen stressed. The author does not have any data to indicate the actual ground cover. However, the average NDVI readings measured prior to treatment applications were 0.13. A wheat variety trial assessed for NDVI at the same site on a similar day recorded a trial average NDVI reading of 0.55. The other trial had received an additional 106 kg N/ha compared to this trial. As a result, all the treatments were likely to mainly provide N via soil, with only a small proportion in the "foliar" treatments intercepted by the canopy in this case.
To assess the impact of rainfall on crop nitrogen uptake the trial was established to include treatments exposed to follow-up rain and no follow-up rain. The fickle nature of rainfall in the Mallee means that finding appropriate application times can be challenging. Further to this the fact that the variates require different quantities of rainfall makes it necessary to apply the treatment applications of the two variates at different times and therefore crop growth stages.
Table 2 shows that the prevailing rainfall conditions for the 10 days after application (DAA) were relatively consistent with the trial design. That said the follow-up rain variates received many small rainfall events to total 11.9mm. While this should be enough to ensure the nitrogen is washed into the soil it is not the desired large single rainfall event. While the maximum daily temperatures over the ten days were cool (<18.5◦ C) the potential for loss through volatilisation is still quite high. In similar work conducted on a Kalkee clay loam, urea applied was completely hydrolysed by Day 7 at 25°C, by Day 10 at 15°C, and by Day 15 at 5°C. (Suter et al, 2011). On the lighter soils of Watchupga East the urea could be expected to be lost even more rapidly.
The no follow-up rain variate only received very small quantities of rain which should not have affected the desired outcome of the variate. Of greater interest are the higher temperatures present over the period with three of the ten days reaching in excess of 25◦ C. These temperatures are at level where it could be expected that the nitrogen reactions would progress at a significant rate. In the 10 days post application there was an 8.9◦ C difference between the average daily maximum temperatures between the follow-up rain and no follow-up rain variates. This is a significant difference and has the potential to influence volatilisation rates between the two variates.
Table 2. Maximum daily temperature and rainfall received in the ten days following application of the follow-up rain and no follow-up rain variates.
Follow-up Rain | No Follow-up Rain | |||||
Date | Max Daily Temp | Rainfall (mm) | Date | Max Daily Temp | Rainfall (mm) | |
| 16-Aug | 18.5 | 1.0 | 29-Aug | 22.0 | 0.2 | |
| 17-Aug | 14.0 | 2.1 | 30-Aug | 21.0 | 0.3 | |
| 18-Aug | 18.0 | 0.4 | 31-Aug | 24.5 | 0.0 | |
| 19-Aug | 12.5 | 5.3 | 1-Sep | 27.5 | 0.0 | |
| 20-Aug | 13.0 | 0.9 | 2-Sep | 26.5 | 0.0 | |
| 21-Aug | 14.5 | 0.0 | 3-Sep | 27.0 | 0.0 | |
| 22-Aug | 14.5 | 0.6 | 4-Sep | 30.0 | 0.0 | |
| 23-Aug | 16.5 | 1.3 | 5-Sep | 22.5 | 0.0 | |
| 24-Aug | 15.5 | 0.3 | 6-Sep | 17.0 | 1.6 | |
| 25-Aug | 17.0 | 0.0 | 7-Sep | 19.5 | 0.0 | |
| Mean | 15.4 | - | Mean | 24.3 | - | |
| Total | - | 11.9 | Total | - | 2.1 | |
The rainfall received following treatment applications was suitable to allow a rigorous assessment of the need for follow-up rainfall post nitrogen applications. The average total plant nitrogen from 1 meter of crop row did not yield any differences between treatments at 10DAA (N.B. Dry matter data was not available for the 4DAA follow-up rainfall variates). However, at anthesis the UAN streaming nozzles and urea top dressed treatments both had a higher total plant N at anthesis compared to the UAN standard nozzle and liquid urea treatments (Table 3).
Table 3. Average total plant nitrogen from 1 meter of crop row 4 and 10 days after application and at anthesis.
Treatment | Total Plant N 4 DAA (no follow-up rain only)* (kg/ha) | Total Plant N 10 DAA (kg/ha) | Total Plant N at Anthesis (kg/ha) |
| UAN streaming nozzles | 23.2 | 30.5 | 30.5a |
| Urea top dressed | 19.3 | 26.0 | 29.9a |
| UAN inter-row only | 19.3 | 25.4 | 26.6ab |
| UAN standard nozzles | 22.1 | 25.4 | 24.0b |
| Liquid Urea | 20.1 | 31.4 | 17.3c |
| Sig. Diff. LSD (P=0.05) CV% | NS | NS | P=0.021 8.4 31.7 |
No treatment by rainfall interactions were evident from the total plant nitrogen results 4DAA or at anthesis. However, the UAN streaming nozzles treatment had more N uptake with no rain compared to with rain (Figure 1). The rain may have washed some of the ionic N from the leaves but the effect was not seen in the UAN applied with standard nozzles. No clear reasons can be ascribed to this interaction.
Figure 1. Total plant nitrogen by treatment and rainfall 10DAA (P=0.049, LSD = 7.5 & CV = 18.6%)
No yield response to treatment or treatment by rainfall interaction was generated in this trial. However, rainfall following N application produced a higher yield compared to no rain. At maturity, there were no treatment or treatment by rainfall interactions for grain yield in this trial.
Table 3 show that in this trial protein was influenced by follow-up rainfall and the treatments. However, that said the protein results were very low (<9.9%) with all treatments achieving an AGP specification. None of the increases in protein resulted in an increase in grain quality specifications as they were all below the 10.5% threshold to reach a higher grade.
The low protein results for all treatments are indicative of insufficient nitrogen being available to the crop. This was evident during the growing season with all treatments showing vising signs of nitrogen stress. While this situation is not ideal it should have enabled treatment differences to be expressed and highlight any volatilisation that may have been occurring.
Table 3: Average yield (t/ha) and protein (%) for the nitrogen treatments and rainfall variates
Treatment | Yield (t/ha) | Protein (%) | ||
Follow-up Rain | No Follow-up Rain | Follow-up Rain | No Follow-up Rain | |
| UAN inter-row only | 1.75 | 1.54 | 9.6ab | 9.3a |
| Urea top dressed | 1.69 | 1.69 | 8.5c | 9.9a |
| UAN streaming nozzles | 1.76 | 1.50 | 8.7c | 9.1bc |
| UAN standard nozzles | 1.60 | 1.51 | 8.6c | 8.8c |
| Liquid Urea | 1.59 | 1.26 | 8.9c | 8.9c |
| Average | 1.68 | 1.50 | 8.9 | 9.2 |
Sig. Diff Treatment Rainfall Treatment x Rainfall LSD (P=0.05) Treatment Rainfall Treatment x Rainfall CV% | NS P=0.005 NS - 0.12 - 11.7 | P=0.011 P=0.016 P=0.006 0.4 0.3 0.6 4.6 | ||
Figure 1 shows the average total grain nitrogen uptake by treatment. Total nitrogen is calculated by multiplying the yield with the protein percentage and applying a multiplier (protein %/0.57) that is based on the nitrogen portion of protein. The UAN inter-row only and top dressed urea treatments achieved significantly higher total average grain nitrogen compared to the UAN standard nozzle and liquid urea treatments.
Irrespective of follow-up rainfall, in this experiment applying nitrogen to the soil achieved the greatest plant uptake. It is seems that the liquid urea applications to the leaves of the crop (standard nozzles) did not result in as high nitrogen uptake as the soil applied (UAN inter-row, streaming and urea top dressed) treatments. There are two potential reasons to account for the improved nitrogen uptake from soil applied treatments over the liquid leaf applied treatments: the first is the fact that the crop was nitrogen stressed at the time of application and had a smaller leaf area reducing the opportunity for nitrogen uptake and second, rainfall received soon after application under both variates was enough to wash the nitrogen off the leaves of the crop reducing the opportunity for leaf uptake. From these results it is difficult to quantify exactly why the leaf applied applications did not results in grain nitrogen accumulation. However, the low crop cover at application suggests that most of the N was taken up through the soil anyway. Dilute and widely dispersed urea is effective in very small particles that may react more quickly than larger granules or streams of UAN.
In addition, with the UAN inter-row, urea top dressed and UAN streaming nozzles all achieving comparable total grain nitrogen results it appears that there is no penalty or benefit from using UAN over urea or vice versa provided it is applied to the soil. It is also apparent from the results that the liquid urea did not perform as well as UAN or its granular counterpart.
Figure 2. Average total grain nitrogen (kg/ha) by treatment (P = 0.011, LSD = 3.29 & CV = 12.8%)
Table 4 shows the fertiliser efficiency achieved by each treatment. N fertiliser efficiency is the proportion of the extra N applied that ends up in the grain and is removed at harvest above the control of the applied 18kg/ha. The 47% efficiency achieved by the UAN inter-row only treatment seems relatively inefficient ‘but typically only 50% of nitrogen applied is taken up by the crop’ (Anderson and Garlinge, 2000). The other 50% may be lost as ammonia gas to the atmosphere or remains in the crop residues or is still in the soil. The UAN standard nozzles and liquid urea had very poor efficiency.
Table 4: Total average grain nitrogen, accumulated grain nitrogen above the control and nitrogen feriliser efficiency by treatment.
Treatment | Total Grain N (kg/ha) | Accumulated grain N above the control* (kg/ha) | N fertiliser Efficiency (%) |
| UAN inter-row only | 27.3 | 8.5 | 47 |
| Urea top dressed | 27.2 | 8.4 | 47 |
| UAN streaming nozzles | 25.3 | 6.5 | 36 |
| UAN standard nozzles | 23.7 | 4.9 | 27 |
| Liquid Urea | 22.0 | 3.3 | 18 |
The results from this trial gives a general indication that applying the fertiliser to the soil would give the greatest nitrogen use efficiency and that there was no penalty or benefit from using UAN over urea or vice versa. The nitrogen stress experienced by the crop in this trial may have disadvantaged the leaf applied nitrogen treatments.
Commercial practice
A common question that arises in the cropping season is how much nitrogen is lost when fertiliser, particularly urea, is applied and follow-up rain does not occur immediately after application? One method adopted by growers to reduce the likelihood of volatilisation is to use UAN. There is a perception that a large portion of the nitrogen when applied as UAN is taken up by the crops leaves and that there is a reduced need for follow up rain. Results from this trial do not completely support that idea. The soil applied urea was equally efficient as the UAN and better than the other modes of delivery. Given these results growers can utilise both urea and UAN with confidence that they equally as effective when applied to the soil. As such growers should use the product that they are best equipped to provide the crop both in terms of timeliness and cost. Because of the low canopy density, most fertiliser - either "foliar" or "soil" applied was likely to be mainly taken from the soil. Further work is required to assess the efficiency of foliar uptake of UAN and Liquid urea in a non-stressed situation and with a larger canopy.
References
H.C. Suter, P. Pengthamkeerati, C. Walker and D. Chen (2011). Influence of temperature and soil type on inhibition of urea hydrolysis by N-(n-butyl) thiophosphoric triamide in wheat and pasture soils in south-eastern Australia. Soil Research CSIRO Publishing
W.K Anderson and J.R. Garlinge (2000). The Wheat Book Principles and Practice Agriculture Western Australia.
V. Fernandez, T Sotiropoulis and P Brown (2013). Foliar Fertilization, Scientific Principle and Field Practices. International Fertilizer Industry Association (http://www.fertilizer.org/HomePage/LIBRARY/Our-selection2/Fertilizer-use.html/Foliar-Fertilization-Scientific-Principles-and-Field-Practices.html)
Acknowledgments
This trial was partially funded by the International Plant Nutrition Institute