What’s new in Zinc – and some critical reminders?
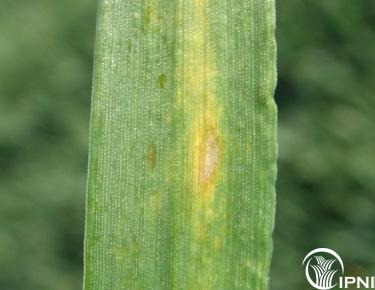 Zinc deficiency in wheat
Take home messages
· Low supply is typically associated with alkaline soils over a wide range of textures. The use of lime can reduce zinc availability.
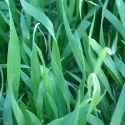
· Zinc deficiency symptoms appear as oily grey green patches in the center of leaves. Young leaves most affected.
· Critical soil test values (DTPA) are generally less than 0.5 mg/kg, but taken alone test values are not a reliable predictor of zinc response.
· Tissues tests help guide diagnosis, and critical tissue concentrations in youngest expanded blade of wheat <14 mg/kg but the response curve is very steep.
· Zinc supplements can be applied with fertilizer as zinc oxide, chelated zinc or zinc sulfate. The latter products are soluble and can also be used for foliar applications. Product efficacy varies with the time and placement of application.
· No single source is a “silver bullet” to all situations
Zinc in soils and plants
Zinc is one of the 16 essential nutrients that plants need for growth and reproduction. Zinc is a micronutrient and is required in smaller amounts than some other nutrients, but it is essential. If Zn is limiting or in short supply, crop yields will suffer, and crop utilization of water and nutrients will decrease. Grain Zn contents is related to seedling vigor and there is also an important link to human health with grains being a major source of dietary zinc for many in the world (http://www.harvestplus.org/content/crops).
Zinc deficiency was one of the first micronutrients recognised as essential and is considered the classic deficiency on alkaline soils such as Vertosols and Calcarosols. It is still the major micronutrient deficiency facing cropping systems in Australia, particularly since the change from single superphosphate (0.04% Zn impurity) to MAP and DAP (Holloway et al. 2008). Information from a range of researchers working in this area suggests that chronically Zn deficient sites are not common, and that while Zn responses are often seen in terms of increased grain Zn concentration, significant yield benefits are less common (Peck et al. 2008).
Typically, zinc supply for susceptible can be low on many soil types, but common properties are pH>7.5, high sand content and where soils are cold, wet and compacted. Zinc can also bind to iron and manganese so red acidic soils can be Zn responsive. Liming can alter root zone pH and so induce a zinc (and manganese) deficiency if not applied well ahead of planting.
Plants growing on soils testing very high in phosphorus (P) commonly suffer Zn deficiency. This syndrome is sometimes mistakenly considered due to a P tie-up of Zn in the soil but competition for nutrient transporters is more likely. Applying P to a soil with sufficient Zn levels will not produce a Zn deficiency.
Much of the available Zn is associated with the organic matter in the topsoil. Land leveling and erosion can cause Zn deficiencies in crops by exposing subsoils low in organic matter, low in native Zn, or with a higher pH.
Zinc deficiencies tend to occur early in the growing season when the soils are cold and wet. This is due to slow root growth compared to rapid shoot growth. The slow growing root system is unable to take up enough Zn to supply the shoot. Plants sometimes appear to outgrow this deficiency, but the damage has already been done, and yields can still be significantly reduced. Root pruning herbicides such as SU’s can give a similar response.
A survey of soil test values from the NVT sites showed on a wide range of more intensively farmed soils. The soil test data showed that 15% of samples had low topsoil DTPA-Zn, and 15% of wheat grain samples had low grain Zn (<15 mg/kg), even though quite a few sites had supplementary zinc. A larger data set of soil tests indicated that about 30% of soil tests from New South Wales had DTPA Zn <0.5 mg/kg. Typical grain Zn concentrations for our cropping regions are around 20 mg/kg for wheat (Table 1), so off-take in a 4 t wheat crop is less than 100 g/ha. However, soil has a strong capacity to bind Zn and balancing removal is not a useful concept for this nutrient.
Table 1. Mean values (± standard errors) of soil pH, Clay (%), Organic Carbon (OC%), DTPA extractable Zn in the top 10 cm, from NVT soil tests 2008-2012.
| ASC Order | pH (CaCl2) (0-10 cm) | Clay % (L1) | OC% | Mean Critical Zn (mg kg-1) | DTPA Zn (0-10 cm) (mg kg-1) | Wheat Grain Zn (mg kg-1) |
| Calcarosol | 7.3±0.1 | 18±9 | 1.7±1.6 | 0.25 | 1.1±0.7 | 18.6±0.9 |
| Chromosol | 5.6±0.1 | 14±7 | 2.1±1.3 | 0.20 | 2.1±0.3 | 22.6±1.1 |
| Dermosol | 6.8±0.1 | 29±9 | 2.5±1.5 | 0.26 | 0.8±0.6 | 16.7±3.0 |
| Ferrosol | 6.6±0.2 | 15±8 | * | 1.7±0.9 | 23.3±3.0 | |
| Kandosol | 5.3±0.1 | 12±4 | 1.8±1.0 | 0.21 | 1.4±0.4 | 17.3±0.9 |
| Sodosol | 6.7±0.1 | 14±7 | 2.9±1.4 | 0.21 | 0.8±0.4 | 17.8±0.5 |
| Tenosol | 6.0±0.2 | 11±6 | 2.0±0.8 | 0.19 | 0.6±0.9 | 21.7±1.3 |
| Vertosol (pH<7.0) | 6.3±0.1 | 44±4 | 1.7±1.1 | 0.32 | 0.8±0.4 | 23.6±0.8 |
| Vertosol (pH>7) | 7.8±0.1 | 44±4 | 1.4±0.6 | 0.6±0.3 | 22.4±0.8 | |
| Means | 6.7±1.2 | 0.9±2.0 | 20.0±0.4 | |||
| % below Critical | 22% | 15% | 15% |
Based on this risk assessment, all soil orders evaluated seem to have a moderate to high risk of Zn deficiency, and wheat grain analysis does show low Zn concentrations. Soil tests are quite variable and show low Zn, but the relationship between grain Zn and soil test Zn is weak, even with the inclusions of other soil factors such as pH and organic C. Many of the Zn recommendations in the eastern states have been developed for alkaline cropping soils, and as yet there are few published reports of Zn responses in the high rainfall zones.
Soil tests to predict crop response
Soil tests for zinc and other micronutrients are available, most commonly either DTPA or EDTA extractable Zn. These two tests give similar numeric values (Norton, 2013). While soil tests have been correlated to crop responses in properly conducted trials, the trials have been limited and the confidence limits can be quite large. As a result the critical levels developed, which are often very low in absolute terms are subject to sampling errors and analytical reliability make them difficult to confidently apply. As with all soil testing, it is important to use accredited laboratories that use ASPAC accredited methods for assessing nutrients – these tests are ones that have critical values established for Australian conditions.
The current recommendations for critical DTPA Zn are variously given as 0.5 to 1.0 mg/kg, but this value is strongly influenced by soil pH, soil texture and soil organic carbon contents (Brennan 1992). Table 1 gives estimates of critical values for various soil types and in most cases these are between 0.2 and 0.4 mg/kg. Dang et al. (1993) proposed that including Zn buffering power of the soil in combination with DTPA-Zn values would improve the reliability of this soil test on Vertosols.
In general, these values are sufficient to meet Zn demands by crops, but recent research in the US has suggested that high yielding maize crops (Ciamoitti and Vyn 2013). There is little evidence to support the idea that high yielding cereals in Australia have a higher critical DTPA-Zn value. On the other hand, there is genetic variation in zinc efficiency among wheat varieties but the detail of this interaction is not known, but a comparison of grain Zn contents from NVT trials showed no differences among Elmore, Gregory, Gascoyne and Scout. An earlier survey showed that Yitpi was more zinc efficient than Gladius (Norton 2013).
It is uncertain how root associations such as with VA mycorrhizae may affect critical soil Zn value, as infected roots are more efficient at accessing Zn (and P) than poorly colonized roots. Ryan et al. (2002) showed that while VAM colonization did not affect early growth, P and Zn uptake to anthesis or grain yield, colonized plants had higher grain Zn contents in one experiment.
Plant Tissue Tests
While soil tests provide a guide, the literature supports diagnosis of potential response is more reliable where tissue tests are taken. It is critical to take the correct tissue at the correct time, as uptake and redistribution differs with time and tissues. Zinc has low mobility so the usual tissues to sample are the youngest fully expanded leaf (youngest expanded blade – YEB). Table 2 gives the critical values for zinc in a range of tissues. Younger more rapidly growing tissues are more responsive to changes in Zn supply so are better indicators of deficiency than older leaves or whole plants. Plant stage is also critical, as the plant matures Zn is redistributed and diluted, critical levels decline with plant age. YEB samples are also suitable for other micronutrient tissue tests.
Of all the tissue tests for micronutrients, Zn taken from the correct tissue at the correct time is one of the best diagnostics. Even so, there can be problems with positional unavailability of Zn in soil profiles or cold periods reducing uptake. These conditions need to be used when interpreting the tissue test results.
Also included in Table 2 are values for Zn in grain. These can be used to track trends in paddock supply over time and have some diagnostic value within cropping systems. Grain Zn content is particularly important for seedling vigour – especially in cereals, and it is the seed content – not concentration – that is important. A supply of less than 500 ng Zn/seed is considered limiting, which in 32 mg seed is a concentration of around 16 mg/kg (Rengel and Graham 1995). Larger seed could have a lower concentration but still supply the 500 ng Zn.
Table 2: Critical tissue Zinc concentrations for a range of species (Reuter and Robinson, 1997). All values are from Australian research, except that marked with an asterisk.
| Species | Sampling Time | Tissue | Critical or deficient Value |
| Barley | 5 leaf | Youngest expanded blade | <14 mg/kg |
| Maturity | Grain | <8 mg/kg | |
| Canola | 3-5 leaf | Youngest mature leaf | <12 mg/kg |
| 3-5 leaf | Youngest open leaf | <27 mg/kg | |
| Start stem elongation | Youngest mature leaf | <8 mg/kg | |
| Start stem elongation | Youngest open leaf | <16 mg/kg | |
| Maturity | Grain | <29 mg/kg* | |
| Chickpea | 45 days after sowing | whole shoot | <34 mg/kg |
| Vegetative | Youngest mature leaf | <22 mg/kg | |
| Maturity | Grain | <28 mg/kg | |
| Fababean | First flowers | Youngest open leaf | <19 mg/kg |
| First flowers | Whole shoot | <26 mg/kg | |
| Maturity | Grain | <14 mg/kg | |
| Field Pea | First flowers | Youngest mature leaf | <22 mg/kg |
| Maturity | Grain | <20 mg/kg | |
| Lupin | Pre-flowering | Youngest mature leaf | <13 mg/kg |
| Maturity | Seed | <19 mg/kg | |
| Sorghum | GS 3 | Youngest mature blade | <10 mg/kg |
| Maturity | Grain | <10 mg/kg | |
| Sunflower | R2 | Youngest mature leaf | <12 mg/kg |
| Wheat | 23 days after emergence | Whole Shoot | <15-25 mg/kg |
| Mid-Late Tillering | Youngest expanded blade | <14 mg/kg | |
| Mid-Late Tillering | Youngest emerged blade | <16 mg/kg | |
| Mid-Late Tillering | Whole shoot | <9 mg/kg | |
| Maturity | Grain | <15 mg/kg |
Addressing Zinc Deficiency
If the indicators used suggest zinc response is likely, there are several options available. Irrespective of the strategy, there are a couple of important aspects of using supplementary Zn.
· Because roots move to zinc, the distribution for drilled Zn needs to be even and banding with a product that has a reliable particle size and Zn content is important. Soil mixing (eg via cultivation) can dilute Zn concentration, and if placed too shallow, the Zn can be “stranded” in dry soil if the season is slow to take up.
· Crops differ in their response to zinc, so within a rotation, it is more important to apply zinc ahead or onto responsive crops. In general, canola is relatively more efficient than cereals at accessing soil Zn (Brennan and Bolland 2002), while lupins, fababean and chickpea have lower demands than wheat and lentils have a higher demand (Brennan et al. 2001). Maize and sorghum have higher Zn demands than wheat or barley.
· While foliar Zn can be used for rescue operations, it has little residual value while soil applied Zn (with macronutrient) has a residual value of 2-5 crops depending on soil texture and pH. So, in a crop rotation, address the Zn demand in the cereal phase rather than the pulse or oilseed phase.
· Yield increases with added zinc are less common than increases in grain zinc (Peck et al. 2008).
Right source of Zinc
There are a large number of zinc products that can be blended or coated with dry fertilizers, used as a seed dressing, or applied as an in-crop foliar application. The source can be inorganic, synthetic chelates or from natural organic complexes. The cost and efficiency of these different products varies significantly and the final decision is based around cost versus efficiency. Table 3 gives some properties of different Zn sources.
Table 3. Selected Zinc fertilizers (from Alloway 2008).
| Compound | Zinc Content | Formula | Water solubility | Cost |
| Zinc Sulfate monohydrate | 36% | ZnSO4.H2O | High | Low |
| Zinc Sulfate heptahydrate | 22% | ZnSO4.7 H2O | High | Low |
| Zinc Oxysulfate | 20-50% | xZnSO4.xZnO | Variable | Low |
| Zinc chloride | 50% | ZnCl2 | High | Low |
| Zinc nitrate | 23% | Zn(NO3)2.3 H2O | High | Medium |
| Zinc phosphate | 50% | Zn3(PO4)2 | Low | ? |
| Zinc fritts | 10-30% | fritted glass | Very low | ? |
| Ammoniated zinc sulfate | 10% | Zn(NH4)SO4 | Solution | High |
| Sodium Zinc EDTA | 9-13% | Na.ZnEDTA | High | High |
| Zinc Oxide | 50-80% | ZnO | Sparingly-low | Low |
Source selected will depend on the desired solubility and the type of soil to which it is to be applied. Zinc sulfate is more effective than zinc oxide on alkaline soils but both sources are equally effective in an acid soil (Brennan and Bolland 2006). Otherwise the agronomic value of the source depends on the solubility and concentration of Zn in the product. On the other hand, less soluble sources have lower residual value. The efficiency of sparingly soluble Zn sources such as ZnO, ZnCO3, zinc fritts in fine textured high Zn fixing soils was at par to highly soluble zinc sulfate heptahydrate. When sparingly soluble and soluble zinc sources are compared in coarse textured soils, soluble zinc sources give the best performance.
Cost is major consideration, and the cost can vary ten fold between products, especially with chelated products. To estimate the cost per kg of Zn supplied, use the formula:
$/kg zinc = Cost per tonne of product/%Zn/10
The uptake of zinc from compound fertilizers depends on the pH of the carrier (among other things). Mortvedt and Gilkes (1993) concluded from their literature survey that Zn incorporated into DAP based fertilizers is unlikely to be a fully effective Zn source, especially in neutral to alkaline soils. Coating of MAP granules with ZnO transforms all the applied ZnO to zinc ammonium phosphate species, which limits expected Zn solubilty and diffusion in soil. Coating of ZnO on urea granules reduced the solubility of Zn compared to coating on MAP granules (Milani et al. 2010). More recent research has showed that Zn diffuses more slowly from DAP than MAP because of the higher pH (stronger sorbtion), and there appears to be more Zn-P minerals precipitated from a DAP source compared to a MAP source (deGryse et al. 2012).
Other work has shown that distribution in the granule and then in the seed row is also important. Reduced rhizosphere pH due to root exudates or regions around acidic fertilizer granules is thought to assist with the solubilisation of soil Zn under alkaline conditions.
In some situations, there has been very good responses to deep-placed micronutrients in South Australia (Holloway et al. 2008) and in the northern grains region (Bell, pers. Comm.). No more than about 3% Zn (as zinc sulfate heptahydrate) can be added to P fluid fertilizers (There is a limit to the amount of Zn that can be added to P solutions (Holloway et al. 2008).
In terms of foliar sources of zinc, Brennan (1991) found zinc chelates 1.4 to 1.7 times more effective than zinc sulfate applied at GS14, but they were equally effective at GS23-24 on wheat. In the same experiment, zinc sulfate banded with the seed at sowing produced the highest grain yields.
Right time for Zinc
In my opinion the best time to apply Zn is at seeding, mixed/blended with dry or fluid fertilizers. Using Zn fortified seed can also reduce the need for added zinc. However, under a moderate deficiency, crops are able to take up and respond to Zn applied before stem elongation. Later applications – up to flowering – can increase grain zinc content but will do little in terms of yield response.
As already mentioned, using soil applied zinc ahead of the most responsive crops seems a good strategy that balances cost and risk.
Conclusions
Use a soil tests, paddock history, soil characteristics, crop demand, and tissue tests to see if there is a likelihood of zinc responses. Soil tests get a 4/10 while tissue tests get 7/10 in diagnosing response to extra zinc. Water-soluble zinc content is a good indicator of agronomic effectiveness, but no formulation can provide more zinc that the amount supplied. In acidic soils, water insoluble fertilizers such as ZnO can be equally effective in improving plant growth when soil is Zn deficient. When incorporated into acidic fertilizer, ZnO and ZnSO4 can be also similarly effective in providing zinc to the plants.
References
Alloway BJ, 2008 Zinc in Soils and Crop Nutrition. http://www.fertilizer.org/ifa/HomePage/LIBRARY/
Bell R, Dell B. 2008. Micronutrients for Sustainable food, feed, fibe and bioenergy production. IFA. http://www.fertilizer.org/HomePage/LIBRARY/
Brennan RF, et al. 2001. Plant Nut.,
Brennan RF, Bolland MDA. 2002. Aust. J. Exp. Agric. 42, 985–993.
Brennan RF, Bolland MDA. 2006. Aust. J. Exp. Agric. 46: 1341–1347.
Brennan RF. 1991. Aust. J. Exp. Agric., 31: 831–834.
Ciampitti IA and Vyn TJ. 2013. Agronomy Journal, 106 (6), 1645-1657.
Dang YP, Dalal RC, Edwards DG, Tiller KG. 1993. Plant and Soil, 155/156, 247-250.
Degryse F et al. 2012. ASA meeting, October 2012, Cincinatti, USA. http://www.adelaide.edu.au/fertiliser/docs/ASA2012_Degryse_visualisation_new.pdf
Fernandez V et al. Foliar Fertilization: Scientifc principles and field practices. IFA http://www.fertilizer.org/ifa/HomePage/LIBRARY/
Holloway R, Graham RD, Stacey SP. 2008. Micronutrient Deficiencies in Australian Field Crops. In BJ Alloway (ed) Micronutrient deficiencies in Global Crop Production, Springer Science.
Milani, N et al. 2010. Proc of 19th world congress od soil science. http://www.iuss.org/19th%20WCSS/Symposium/pdf/1550.pdf
Mortvedt JJ. 1968. Journal of Agricultural and Food Chemistry. 16, 241-245.
Norton RM. 2013. Micronutrient survey and scoping study, Project 16. Grains Research and Development Corporation. 66 pp.
Peck AW, McDonald GK, Graham RD. 2008. Journal of Cereal Science, 47, 266-274.
Rengel Z, Graham RD 1995. Plant Soil, 173: 267–274.
Reuter DJ and Robinson JB (Eds), 1997. Plant Analysis: an interpretation manual. CSIRO Publishing.
Ryan MH, et al. 2002. Aust. J. Agric. Res. 53, 1173-1181.
Tanner, P.D. and P.M. Grant (1973) Rhod. J. Agric. Res. 11: 69-75.
Additional Resources
Zinc talk GRDC Advisor Updates TemoraSize: 7.93 MB
Test soil and plant tissue before adding zincSize: 3.02 MB
GDRC Micronutrient Fact SheetSize: 0.63 MB

