06 Jun 2013
Brookstead Site - 2012/13 Sorghum Results
Managing K in northern cropping systems

Brookstead site, 2012
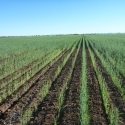
This site was sown to sorghum in summer, 2012. No additional nutrient (other than N) has been applied to assess the residual response of the crop to K applied at different depths and band spacings. Despite floods during January, the site has performed well. Biomass samples were collected to determine access to residual K, and data are shown in Table 2 below. Grain yields will be reported in June.
This site has exhibited strong responses to S and deep P in previous seasons, so the K trial area was treated with deep P and S applications prior to the 2011 wheat crop. We also have collected Farmer Reference samples from untreated areas within each replicate where no P and S was applied.
Data in Table 2 illustrate two major effects – the strong residual effect of the deep P applications from 2011 in overcoming P limitations, and the large impact of adequate crop P nutrition (and presumably a more extensive and effective root system) on crop K acquisition. Crop biomass increased by 60% relative to the Farmer Reference through the addition of P and S in the Control treatment, but there were no further significant increases from the addition of K. Given the lack of any significant change in biomass S concentration, it is concluded that this response is due to improved P nutrition. While crop P uptake increased 80% with the basal deep P application (8.8 kg/ha), the improved crop growth also resulted in a 57% increase in K accumulation (an additional 61 kg/ha). While K applications resulted in higher tissue K concentrations and further K acquisition (a further 25-30 kg K/ha), this would appear to be luxury acquisition given the lack of biomass response.
The interactions between P and K nutrition in many cropped fields are complicating the development of more consistent guidelines of the need for K fertiliser and the optimal application strategy.
Table 2. Biomass production and K uptake by sorghum in response to K band spacing and placement depth treatments applied prior to the wheat crop in 2011 at Brookstead.
| Treatment | DM | K (%) | K-uptake (kg/ha) | P (mg/kg) | P-uptake (kg/ha) | S (mg/kg) | S-uptake (kg/ha) | Grain yield (kg/ha |
| Farmer ref | 9260 | 1.15 | 107 | 1120 | 10.5 | 800 | 7.4 | 5331 |
| Control (PS) | 14900 | 1.13 | 168 | 1290 | 19.3 | 820 | 12.2 | 6964 |
| PS + Shallow K 25cm | 17110 | 1.26 | 225 | 1300 | 21.5 | 770 | 12.7 | 6903 |
| PS + Shallow K 50cm | 14533 | 1.25 | 182 | 1300 | 18.9 | 800 | 11.6 | 7118 |
| PS + Shallow K 100cm | 16970 | 1.21 | 205 | 1430 | 24.3 | 800 | 13.6 | 7177 |
| PS + Deep K 25cm | 14860 | 1.20 | 178 | 1270 | 18.9 | 770 | 11.4 | 7315 |
| PS + Deep K 50cm | 15110 | 1.27 | 192 | 1230 | 18.6 | 770 | 11.6 | 7201 |
| PS + Deep K 100cm | 14090 | 1.34 | 188 | 1300 | 18.3 | 830 | 11.8 | 6487 |
| PS + Shall+Deep K 25cm | 15380 | 1.27 | 196 | 1230 | 19.0 | 770 | 11.7 | 7205 |
| PS + Shall+Deep K 50cm | 15950 | 1.31 | 208 | 1230 | 19.6 | 800 | 12.8 | 7589 |
| PS + Shall+Deep K 100cm | 15500 | 1.25 | 194 | 1300 | 20.2 | 800 | 12.4 | 6026 |
| LSD (P<0.05) | 2520 | 0.16 | 42 | 170 | 4.5 | ns | 2.0 | 707 |
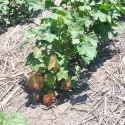
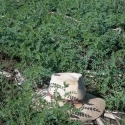
Unfortunately the dryland cotton crop adjacent to the sorghum site, where a PKS experiment similar to that at Capella had been established, was terminated due to insect and flood damage.