03 Sep 2013
Wheat Grain Micronutrient Content in Southeastern Australia
Poster paper presented at IPNC, Turkey
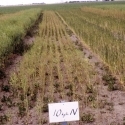
 Wheat heads in Victorian paddock
Robert M. Norton
International Plant Nutrition Institute, 54 Florence St, Horsham, Victoria, 3400, Australia. (rnorton@ipni.net)
INTRODUCTION
Wheat is Australia’s major crop and it is grown across areas where deficiencies of Fe, Mn, B, Cu, and Zn are common, and also where Mn, B and Al are at toxic levels in the soil. There are some data on grain micronutirents contents for wheat (Reuter and Robinson 1997) but there is little information on spatial or temporal variation of modern varieties.
Improving Zn and Fe content of wheat will have large impacts on the health of those on grain based diets (Cakmak et al. 1999), while at a farm level grain micronutrient content may assist to identify trends in micronutrient supply so that these deficiencies can be addressed. Grain micronutrient content, especially Zn, is important for seedling vigour (Rengel and Graham 1995).
The data presented here is a summary of a wheat grain nutrient survey over the southeastern Australian production region and provides data on temporal, genetic and spatial differences in micronutrient concentrations.
METHODS
Wheat grain samples of two varieties (Yitpi and Gladius) were collected from the 2008 and 2009 seasons from 70 sites across 12 agro-ecological regions in southeastern Australia. The grain was sourced from national variety trial sites, managed using commercial best practice. Site details can be obtained from the author.
Grain samples from each site were randomly selected from the harvested grain sub-sample, dried, weighed and processed for nutrient analysis by Inductively Coupled Plasma Optical Emission Spectrometer (ARL 3580 B, Appl. Res Lab. SA, Ecublens, Switzerland) and results are reported on a dry grain basis. This report will only present data for Al, B, Cu, Fe, Mn and Zn.
Because the data set developed was not balanced, nor were there replicated samples from each site in each year, the data were assessed using a one-way analysis of variance to compare nutrient densities using either site (70 site years) or varieties (Gladius and Yitpi). In addition, the data set from South Australia was used to compare annual nutrient densities in 2008 and 2009.
RESULTS and discussion
Table 1 shows that there are significant regional and genotypic differences for all grain micronutrient levels tested and temporal differences for B, Cu, Mn and Zn. There were significant genotypic differences between Yitpi and Gladius, with the former Zn content 25.0±0.8 mg kg-1 and the latter 21.1±0.9 mg kg-1. Similarly, grain Al contents were 3.4±0.5 mg kg-1 for Yitpi and 5.2±0.5 mg kg-1.
Table 1. P values for the F test in one-way analyses of variance for regions, cultivar or year from the NVT data set analyzed.
| Al | B | Cu | Fe | Mn | Zn | |
| Regions | 0.001 | 0.000 | 0.000 | 0.000 | 0.000 | 0.003 |
| Cultivars | 0.007 | 0.661 | 0.565 | 0.695 | 0.568 | 0.001 |
| Year (SA only) | 0.651 | 0.000 | 0.041 | 0.700 | 0.007 | 0.049 |
Even though micronutrient content could not be significantly correlated with soil pH (not shown), regional micronutrient concentrations (Table 2) reflect the soil conditions that are common in those regions. Alkaline soils are common in the SA Murray Mallee, SA Lower EP and the Vic Mallee, and these regions show the lowest grain Fe, Mn and Zn levels. Conversely high Al, Fe and Mn levels could be expected on acid soils, and is seen in the NSW South West, NSW South East and Vic North Central. There were also high grain Al contents in the SA Murray Mallee and the SA Upper EP where alkaline soils are dominant, and Brautigan et al. (2012) reported high available Al levels in these soils.
Table 2. Mean and standard deviations of micronutrients (Al, B, Cu, Fe, Mn and Zn) for wheat samples from the 2008 and 2009 NVT sites for Yitpi and Gladius. All values are for dry grain (0% moisture content).
| Region | Site Years | Al mg kg-1 | B mg kg-1 | Cu mg kg-1 | Fe mg kg-1 | Mn mg kg-1 | Zn mg kg-1 |
| NSW South East | 4 | 3.5±1.3 | 1.6±0.3 | 3.9±0.4 | 42.1±2.2 | 57.6±3.6 | 23.0±2.4 |
| NSW South West | 4 | 5.1±1.3 | 1.7±0.3 | 4.1±0.4 | 39.5±1.2 | 54.4±3.6 | 23.5±2.4 |
| SA Lower EP | 6 | 1.6±1.1 | 2.3±0.3 | 4.4±0.3 | 30.2±1.8 | 25.3±3.0 | 18.7±2.0 |
| SA Mid North | 7 | 3.1±1.0 | 1.3±0.3 | 5.6±0.3 | 39.1±1.6 | 51.1±2.7 | 25.4±1.8 |
| SA Murray Mallee | 9 | 7.6±0.9 | 1.9±0.2 | 5.2±0.2 | 40.1±1.4 | 38.9±2.4 | 19.2±1.6 |
| SA South East | 5 | 1.1±1.2 | 1.5±0.3 | 3.5±0.3 | 35.9±1.9 | 26.8±3.2 | 24.5±2.2 |
| SA Upper EP | 12 | 5.5±0.8 | 2.4±0.2 | 4.9±0.2 | 35.9±1.2 | 49.3±2.1 | 26.0±1.4 |
| SA Yorke Penn. | 6 | 3.0±1.1 | 1.8±0.3 | 5.6±0.3 | 31.3±1.8 | 41.8±3.0 | 22.2±2.0 |
| Vic. Mallee | 8 | 4.5±1.0 | 3.4±0.2 | 5.1±0.3 | 34.9±1.5 | 36.8±2.6 | 18.9±1.7 |
| Vic. North Central | 2 | 3.4±1.9 | 1.7±0.5 | 4.7±0.5 | 41.0±3.0 | 55.8±5.1 | 25.5±3.4 |
| Vic. North East | 2 | 5.1±1.9 | 1.4±0.5 | 5.1±0.5 | 44.3±3.0 | 53.3±5.1 | 28.8±3.4 |
| Vic. Wimmera | 5 | 4.6±1.2 | 4.6±0.3 | 4.8±0.3 | 36.2±1.9 | 49.2±3.2 | 27.3±2.2 |
| Mean | 4.3±4.1 | 2.2±1.3 | 4.8±1.2 | 36.8±6.9 | 43.5±13.8 | 23.0±7.3 |
Grain zinc content varied widely across the survey area, and mean grain levels were lower than a desirable levels indicated by Cakmak et al. (1999). Grain zinc levels also varied between regions on a per grain basis, and ranged from around 100 ng Zn kernel to 1600 ng Zn kernel-1 with around 18% of samples having less than 500 ng Zn kernal-1. Compared to the critical levels in Reuter and Robinson (1997), none of the grain samples had Cu levels less than 1 mg kg-1, 8% of samples were less than 25 mg Mn/kg and 60% of samples were less than 2.0 mg B/kg.
CONCLUSIONS
Even under good management, Zn, Mn and B deficiencies (as indicated by grain content) are common in many cropping regions. Further research aims to link these deficiencies to particular soil types so that growers can make a reasoned assessment of the risk of micronutrient deficiency for their production system.
ACKNOWLEDGEMENTS
Grain samples, soil test and location information was provided through A. Bedggood and the National Variety Trials network. The International Plant Nutrition Institute funded the study.
REFERENCES
Brautigan, D.J., Rengasamy, P. and Chittleborough, D.J. 2012. Aluminium speciation and phytotoxicity in alkaline soils. Plant Soil 360: 187-196.
Cakmak, I., Kalayci, M., Ekiz, H., Braun, H.J. Kilinc, Y. and Yilmaz A. (1999) Zinc deficiency as a practical problem in plant and human nutrition in Turkey: A NATO-science for stability project. Field Crops Res. 60: 175-188.
Rengel Z., and Graham R.D. (1995) Importance of seed Zn content for wheat growth on Zn deficient soil. Plant Soil. 173: 259-266.
Reuter, D. and Robinson J.B. (1997) Plant Analysis: An interpretation manual. CSIRO Publishing, Collingwood. 559 pp.