18 Aug 2016
Potassium and sulfur –how much is enough?
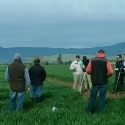
Presented at GRDC Grower Update Skipton
 K responses Wheat - plus K left
Grain producers have become more proficient at managing N in response to seasonal conditions, matching the right source with the right rate and applying the N at the right time and in the right place. In general P management is taken care of with at-sowing SSP, MAP, DAP or TSP, and after sowing there are no practical and reliable options for further interventions with P. As farming systems change, different products become available and hopefully higher crop yields, it is appropriate to review the role of the two other macronutrients – potassium and sulfur.
These two are important nutrients and are required in relatively large amounts – in fact the K demand of plants is similar to the N demand. It is important to consider these nutrients in a balance nutrition program and in the past S supply was largely taken care of by the use of SSP (11%S) while K was not often considered limiting. In presenting the information on these two nutrients it is important to ensure the other aspects of the cropping program are in place – including addressing soil acidity (liming) and sodicity (gypsum) – and to have sound agronomic practices in place so that the response to improved nutrition can be achieved. A summary of the issues concerning K and S is given below.
Potassium:
Why now?
In general, soils in southern Australia have reasonably high soil K levels, and so K use has not been widespread. The use of fertilizer K has been low but with higher yields and increased hay cutting, K removal has increased, and so soil K levels have declined.
Even though grain K removals are relatively modest, cereal crops cut for hay will have around 10 times more K removed than if left for grain (Table 1).
Table 1. Nutrients present in wheat and canola –for grain, straw or hay. Hay figures are when cut at soft dough (wheat) or early flowering (canola).
| Crop Use | N | P | S | K | N | P | S | K |
Wheat – kg nutrient per t | Canola – kg nutrient per t | |||||||
Grain | 25 | 2.5 | 3 | 5 | 30 | 5 | 5 | 10 |
Straw | 5 | 0.5 | 0.5 | 15 | 4 | 3 | 1 | 25 |
Hay | 20 | 1 | 1.5 | 20* | 30 | 3 | 8 | 35 |
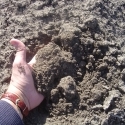
How does it behave in soil?
Potassium is present in the soil as minerals that become K+ (cations) and as such can reside on the exchange complexes of clay and organic matter. They are relatively weakly held and where the soil is dominated by strongly held H+ ions (ie acid soils) the K can be washed down the soil profile. Soil K exists in a range of pools including less available K that is in the inter-layer of clay minerals.
On neutral and alkaline soils, especially those with higher clay contents, K will be less mobile and can become stratified in dry topsoil.
What are the critical soil test values?
The common soil test used in the Colwell K (bicarbonate extraction, given in mg/kg) and this shows good correlation to the estimates of exchangeable K (ammonium acetate extraction, given as cmol(+)/kg). The later multiplied by 390 gives a reasonable estimate of the former.
Because of the mobility of K on some soils, deeper sampling (eg to 30 cm) may give better indications of responses, but these soil tests have not been widely calibrated in the eastern states.
Current best estimates for critical soil test K for the southern region are given in Table 2.
On heavier soils, critical values tend to be less reliable due to other pools of K becoming accessible to the plant.
Table 2 - Critical values (mg/kg) and critical ranges for the 0-10 cm sampling layer for 90 percent of relative yield (Better Fertilizer Decisions for Crops Soil Testing Summary, 2014).
What are the symptoms of deficiency?
K is highly mobile in plants and is involved in many essential functions. It serves to regulate water pressure in plant cells, affecting cell extension, gas exchange, and movement of leaves in response to light. K can activate enzymes, assist with protein synthesis, pH regulation, improved carbon dioxide fixation during photosynthesis. It also assists with transport around the plant. Plants that are supplied with adequate K are also better equipped to withstand stress, including mild drought stress.
The symptoms of K deficiency appear in the older leaves as scorching or firing along the leaf margins. Growth is slow and they develop poor root systems, and subsequent crop performance is poor.
Tissue tests (whole plant) are useful in diagnosing K deficiency, and critical values decline as the plant matures.
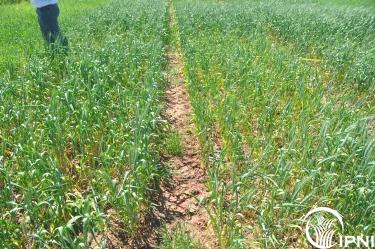
K deficiency is most likely to occur on lighter acid soils where there has been a history of hay cutting. Lighter soils are most likely to show the best responses to supplementary K. Symptoms of K deficiency can often be seen between header tracks or crop windrows – with better growth in the windrow than between. Tissue test to confirm the diagnosis.
What are the appropriate nutrient management strategies?
Right Source: The most commonly used K fertilizer source is potassium chloride (KCl), also referred to as muriate of potash (50%K). Chloride-free sources of K fertilizer are sometimes preferred for applications made to chloride-sensitive crops. Compound fertilizers containing chloride, sulfur and/or magnesium are appropriate when soil supplies of these other nutrients are limiting.
Right Rate: Recommended rates of K application are based on both soil testing and crop removal. “Maintenance rates” are those equal to the quantities of K removed and are used to maintain soil fertility. Cereal crops require less K than pastures or hay crops.
Right Time: In cropping systems, K fertilizer is usually applied at or before seeding. On soils that are sandy and/or have a low capacity to retain K, two or three applications of K fertilizer may be beneficial. Early applications tend to be much more effective than top dressed K (ie lower rates can be used).
Right Place: Potassium sources vary widely in their effect on the soil solution (salt index). K fertilizer sources with a lower salt index may be used at higher rates when placed near or in direct contact with seed. Subsurface bands of K can provide benefits over broadcast applications when subsoil fertility is lower and when drier growing conditions exist.
Sulfur:
Why now?
The swing away from SSP to ammoniated phosphates has meant the amount of S supplied has declined. There has also been a reduction in atmospheric S deposition due to better pollution controls.
Sulfur removal by canola is nearly twice the sulfur removal of cereals, although the actual S concentration in canola seed is lower than some older figures quoted in the literature (Table 1).
How does it behave in soil?
Sulfur is present in the soil as the sulfate ion (SO42-) which is mobile and can be leached down the profile – obviously more common on lighter textured (sandy) soils. Soil S can be derived from S containing minerals, the oxidation of elemental S (S0) or from the mineralisation of organic S. The bulk of S in the soil is present in organic matter and as a consequence, biological activity is important for S availability.
What are the critical soil test values?
Sulfur soil testing is usually done using a KCl-40 extraction, although there has been discussion if the older mono-calcium phosphate (MCP) test may be a better indicator.
Sulfate can become stratified – with leached S deeper in the profile, and deep sulfate layers such as from native gypsum may need to be considered in assessing potential responses.
Because of its high mobility, topsoil (0-10 cm) soil tests are often unreliable at predicting responses to additional S. Deeper sampling – even to 60 cm – may be appropriate and this can be done using the same sample sent for deep mineral N assessment.
Current best estimates for critical soil test S for the southern region are given in Table 2.
What are the symptoms of deficiency?
Within the plant, S performs many functions, the most important being energy and protein production. S is a constituent of three of the 21 essential amino acids that form proteins. This function is of particular importance in the grains industry as low grain protein correlates to low grain quality. S is also essential for N fixation by legumes.
Sulfur deficiency can sometimes be confused with N deficiency, but S deficient plants show yellowing in the younger leaves, while N appears as yellowing of the older leaves. Plants appear pale and canola flowers can be pale also.
Tissue tests for S are reliable, but they will only assess the surface S if taken early in crop growth, and as the crops grow deeper S may be accessed. It is usual to take the youngest fully expanded leaf for testing.
S deficiency can be seen on lighter low organic matter soils – such as sand hills, especially after heavy rain (leaching the S down). There is uncertainty about S responses at present as the soil tests do not seem reliable either because of the sample taken or the test used.
What are the appropriate nutrient management strategies?
Right Source: There are numerous sources of S fertilizer available for use, some containing soluble sulfate that provides immediately plant available S, and others that contain insoluble elemental S that requires a conversion to sulfate before the plant can access the additional nutrients. Ammonium sulfate is a useful S source but has relatively too much S compared to amount of N. Fluid S sources such as Ammonium or potassium thiosulfate are used for soil applications.
Right Rate: Rates to use will depend on the situation, but replacement rates of S will be around 10 kg S/ha for 3 t/ha wheat or 2 t/ha canola. Where leaching losses are expected, rates should be higher.
Right Time: It is possible to prevent yield losses if S deficiency is diagnosed early in a growing season and is promptly top dressed with a sulfate form of fertilizer. Crops seem able to recover from early S stress. In a cropping system, it is probably best to put the S ahead of the highest S demanding crop (eg canola), and then use the residual S for subsequent crops.
Right Place: Finely divided elemental S may be a useful source, but will require good mixing through the soil. Placement of high rates of ammonium sulfate in furrow can result in crop damage. S fortified MAP has the benefit of good placement and relatively slow S release – especially of the S0 fraction.