21 Jul 2014
Phosphorus best management practice
4R approach to P for wheat
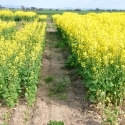
 Flowering wheat spike
• Soil testing and budgeting of P removal and additions can help plan P inputs.
• PBI can give you a guide as to how much P soil is likely to tie up in forms that are unavailable to the crop.
• Placing P close to the seed at sowing is the best way to deliver this vital nutrient.
• There are a range of different sources of P fertiliser available and they should always be considered in terms of individual soil type and also individual budgets.
• High yield is not always high profits - consider how management decisions will affect profitability as well as yields over range of season and price scenarios.
Fertiliser represents a major financial investment in modern cropping systems and so it makes sense to gain the maximum value from this decision. There are a number of ways that farmers can maximize the return from their fertiliser investments
What happens to P fertiliser?
• Most of Australia’s cropping soils have a long history of P application, but only a small proportion of this P is available to the current crop.
• When P is applied to soil up to 70% will be precipitated or adsorbed by the soil into forms that are unavailable to the current crop.
• The crop will access some P from the fertiliser as well as from slowly available pools built up over time.
• The problem is that it is very difficult for plants to access P that is locked up in the ‘soil bank’, this is particularly true on soils with a high phosphorus buffering index (PBI). For this reason, in most cases annual applications of P at sowing are needed to meet the crop requirements.
• Where P application has built up a large P bank, a stable response can be obtained with the use of maintenance P dressings – where P input as fertiliser balances P removal in grain.
The Global “4R” Nutrient Stewardship Framework
Fertiliser Best Management Practices (BMPs) can be aptly described as the application of the right source (or product) at the right rate, right time and right place. These four “rights” (4R) comprehensively convey how fertiliser applications can be managed to achieve economic, social and environmental goals. The framework ensures that FBMPs are developed with consideration of the appropriate focus on all three areas of sustainable development.
The Right Source of P
P source comparisons over three years in the Wimmera, Malllee and Western District showed that MAP was generally the best P source tested. In certain areas, particularly on highly calcareous soils, growers are moving towards supplying P in fluid form.
It has also been found that sulphur fortified MAP showed a 10% improvement over unfortified MAP in two trials. It is not certain if this is due to improved S nutrition or the formulation of the P source itself.
Fluid P sources such as ammonium polyphosphate could provide around a 10% benefit over MAP and these fluid responses were most common on alkaline soils. Across all sites in the Victorian Wimmera and Mallee, we found that fluid P sources were never less efficient than MAP. The presence of free lime is often a good indicator of where fluid P sources will be better than granular P sources, and a “fizz” test with a strong acid can help identify these soils.
Figure 1 shows the improved yields that can come from using fluid P sources. It also shows that this effect varies with soil type. When considering a change to fluid P, factors such as PBI, pH, soil type and Colwell P status should be taken into account.
Figure 1: Granular and fluid P at two rates at two sites (Vic DPI)
The source of P that is selected should be specific to the soil and budget. For example, while fluid P sources can help to reduce the amount of P that is tied up by high PBI soils, they are generally more expensive than granular P sources.
Changing to fluid fertilisers requires a change in equipment to allow for their delivery to the seeding bar and into the soil along with the seed. These costs can be quite significant.
As with all nutrient management decisions, any changes to the source of P being supplied to the crop should be considered in the context of the fertiliser budget for the farm (see financial considerations).
The Right Time and Right Place for P
Because P is relatively immobile in the soil, fertiliser P should be placed as close to the seed as possible, especially where soil P test levels are low. Because MAP is relatively safe near the seed, moderate rates of this fertiliser can be placed quite near the cereal seed. Urea and even high rates of DAP should be located away from the seed row in susceptible crops like canola, especially at high rates or in wide rows. Care should be taken with the placement of some fluid P sources as they can be corrosive to machinery and should be kept away from the seed row. Check the situation at the Seed and Fertilizer
Also, because of its poor mobility top-dressing P after sowing rarely shows a crop response. In virtually all cases, the right time and place for P is at seeding and near to the seed for maximum efficiency.
Crop demand for P peaks during crop establishment, early in the season, and most importantly, early P supply sets up the roots to better access both water and nutrients. Later application with the currently available P sources is unlikely to produce economical responses. In drier years, crops are relatively more dependent on applied P because of a reduced ability to exploit soil P.
There has been some interest in using foliar applied fluid P sources to "top up" the P supplies. While the research has been encouraging, there is uncertainty about crop safety, timing, application technology, relationship to yield potential and product selection.
What is the Right Rate for P
The key to selecting an appropriate P rate is to know how much P is in your soil.
Periodic testing for Colwell P in the top 10 cm of your soil is a good way to estimate soil P levels. This test has been shown to be quite robust across a range of soil types, but has limitations on soils where high levels of calcium carbonate are present. The Diffusive Gradients on Thin-Films (DGT) P test is available through several laboratories,but at present Colwell is the most widely used test for soil P status.
Sampling for P should be done at about the same time of year and careful selection of sampling sites and depths will provide the best estimate of the sample to be submitted for testing. Use an ASPAC accredited laboratory and a FertCare accredited advisor.
Colwell P alone is not always the best test to determine the rate of P to apply to a crop. Rather, it is best used over time in conjunction with other methods to judge soil P requirements. After initial testing, Colwell P can be used to estimate P levels for the next 4-5 years (see P budgeting below), however after this time it is best to retest the paddock.
What Colwell P level is best?
Minimum or critical Colwell P soil test values vary widely depending on soil type, but Table 1 shows the general rules – using a range of values that are accepted as ideal for a range of soils.
Table 1: Minimum or critical Colwell P values for various soils (source GRDC Soil Testing - Southern Region).
| Crop | Soil Type | Critical Value (mg/kg) | Critical Range (mg/kg) |
| Wheat & Barley | Vertosol | 17 | 12-25 |
| Chromosol/Sodosol | 22 | 17-28 | |
| Calcarosol | 34 | 26-44 | |
| Brown/Red Chromosols | 25 | 18-35 | |
| Barley | Ferrosol | 76 | 46-130 |
| Canola | All soils | 18 | 16-19 |
| Field Pea | All soils | 24 | 21-28 |
These critical values have been derived experimentally from a large number of experiments, and these values are usually the soil concentration to reach 90% of maximum yield.
If the soil test reveals Colwell P levels equal to or higher to these values then you may only need to apply enough P fertiliser to replace what the crop takes out, and maintenance applications (removal + fixation) are indicated.
However if Colwell P levels are lower than this, consider applying ‘capital’ inputs of P over and above maintenance requirements to ‘build up’ your soils P levels over time.
Any decisions to alter P rates should always be considered in terms of financial impact higher yields do not always equal higher profit.
What about PBI?
Phosphorus buffering index (PBI) is a soil test done in association with soil P testing that measures how strongly a soil locks up P into forms that are unavailable or only very slowly available to a crop.
Soils with a high PBI (see Table 2) will generally require higher rates of P each year because much of the phosphorus applied is tied up into forms that are not available to the crop.
PBI only needs to be measured once for each soil type and it can be used every year when considering P rates. Soils with a higher PBI will require more applied P to raise the Colwell P test value.
Table 2: What constitutes a high or low PBI value?
| PBI Value | Category |
| Less than 150 | Low |
| 150-300 | Moderate |
| More than 300 | High |
High PBI values are generally associated with highly alkaline ‘calcareous’ soils often found in the Eyre Peninsula of South Australia, however high PBI soils can be found in a broad range of areas.
Recent research has suggested that liquid sources of P may assist with managing high PBI soils - see ‘different sources of P’ below.
P budgeting - tracking P over time
For most cropping regions, the soil has had a strong P application history and so balancing input and output, rather that supplying long-term soil P pools can be a useful approach.
Table 3: Typical P removal rates for various crops
| Crop | P removed per tonne of product (kg/ha) |
| Cereal Grain | 2.6-4.0 |
| Cereal Hay | 1.3-2.0 |
| Cereal Straw | 0.7-0.9 |
| Pulses | 3.3-5.0 |
| Canola | 4.8-5.4 |
When considering how much P to apply it can be useful to look at the paddocks recent history and estimate how much P has been both applied and removed (Table 3). The values in Table 3 are a range and this is because at high soil P levels crops will take up more P than under low P supply states. Despite that, P budgeting allows you to estimate how much P you need to put onto the paddock to achieve your target yield.
Example P budget for a single year:
Crop: Wheat
Yield: 2.0 t/ha
Fertiliser input: 60 kg/ha MAP (21.9% P)
P removed in grain: 2.0 t x 3.0 kg = 6 kg P/ha P added in fertiliser: 60 kg x 21.9% = 13.1kg/ha
Net balance: + 7.1 kg P/ha
In an ideal situation you would aim to have a slight positive net balance of P over a 4-5 year period, after which soil tests such as the Colwell P would provide guidance about the direction of this strategy.
Some growers use yield maps to estimate the pattern of P removal across their paddocks. Variable rate fertilizer applicators, or simple paddock zones, are then used to match the removal patterns identified in the yield map.
The major limitation with P budgeting is that it doesn’t take into consideration P that is locked up in the soil. So that for soils with a high PBI, P budgeting may be somewhat less accurate due to tie up of applied P.
Can you cut back on P when finances are tight?
With volatile fertiliser prices and following a string of below average years this was a question that many were asking at the start of season 2008. Given the uncertainty of weather, the lessons from that season should be remembered for the future.
Research conducted during 2007 investigated the effects of skipping a year of P on wheat yields on a Wimmera grey cracking clay at Kalkee. This experiment showed that following a failed crop in 2006 there was very little carry-over of P from the previous year, except at high P rates (20 kg P/ha).
In general, provided that a paddocks history of P application is good, it may be possible to skip P application following a failed crop (a good P history is generally typified by a high Colwell P figure - see Table 1). As usual, this decision must be weighed against the risk that the season unfolds as an exceptional year and the yield potential of the crop may not be realized.
Soil testing tips for measuring Colwell P
In order to gain a representative sample it may be necessary to take up to 20 soil cores from across the paddock. Try to sample at about the same time each year, and make sure the samples are taken from areas that have not been fertilized in the current season.
Because soil P is relatively immobile, where banding of P is practiced such as with precision placement of fertilizer, soil sampling requires special consideration, as random sampling would give a high test result if only a few bands were included in the sample. Where the locations of the bands or drill rows are known, research has suggested that a ratio of 1:20, 1:16 and 1:8 in-the-band cores to between-the-band cores should be considered for 76 cm, 61 cm or 30 cm band spacings respectively. An alternative is to take a slice of soil across the rows to include banded and non-banded soil, although the reliability of this method has not been evaluated for predicting fertilizer responses relative to other sampling methods.
In paddocks with multiple soil types, try to sample from the dominant soil type. If you are going to manage these soils differently then sample them separately.
Mix the samples thoroughly in a clean bucket and keep them in a cool place until dispatch.
Use a testing service that participates in Inter Laboratory Proficiency Programs such as the program undertaken by the Australian Soil and Plant Analysis Council.
Remember that a bag of soil submitted, in the lab becomes a tablespoon of soil that will represent an entire paddock!
Collated by Rob Norton, Regional Director, Australia and New Zealand on behalf of the project collaborators and supporters.
International Plant Nutrition Institute (http://anz.ipni.net), from GRDC project UM00023, synchronizing N and P demand and supply as part of the Nutrient Management Initiative.
Additional Resources
GRDC Phosphorus Management Guidelines - Southern RegionSize: 0.69 MB
GRDC Soil Testing Guide - Southern RegionSize: 0.58 MB
Agronomy Community Talk July 24 2014, HamiltonSize: 4.15 MB