Australia and New Zealand Regional Profile
 Wheat grain being outloaded at the Natimuk grain terminal
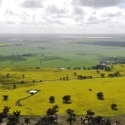
Overview of Agriculture in Australia and New Zealand
An understanding of the fertilizer market in Australia and New Zealand requires a detailed understanding of the agricultural industries in both countries. Australia and New Zealand are separate sovereign nations with a shared common colonial heritage, and have a close economic relationship. They have stable and democratically elected governments with open market economies. Australia is composed of six states and two territories and is the world’s sixth largest country, with the 12th largest economy. New Zealand consists of two main islands 1500 km to the east of Australia. Both countries rank highly in terms of cultural diversity, quality of life, health, education, economic freedom and the protection of civil liberties and political rights. A summary of some national information is given in Table 1.
Table 1. Economic and social indicators for Australia and New Zealand.
| Indicator | Australia | New Zealand |
| Land Area (Mkm2) | 7.69 | 0.27 |
| Percent agriculture (%) | 53 | 57 |
| Area for cropping (Mha) | 50.0 | 1.5 |
| Population (M) | 23.7 | 4.6 |
| Gross Domestic Product ($B) | 1,629 AUD | 245 NZD |
| Economic Growth (%) | 2.5 | 0.9 |
| Inflation (%) | 1.5 | 0.3 |
| Cash Rate (%) | 2.0% | 2.5% |
| Farm gate value agriculture ($B) | 53.5 AUD | 25.8 NZD |
| Value of agricultural exports ($B) | 44.3 AUD | 26.7 NZD |
Agriculture is undertaken predominately on family farms and even though a small percentage of GDP, it contributes about $54 billion and $26 billion to the economies of Australia and New Zealand respectively. Total factor productivity growth is around 2.5% in both countries over the past 20 years, and during the last couple of years growth has been over 6%. Both countries are highly geared to exporting, and producer returns are closely aligned to world market returns. There is little government subsidization of agriculture in either country.
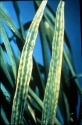
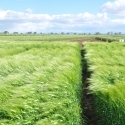
Australia produces around 40 million metric tons (Mt) of grains, with wheat (24 Mt) and barley (7 Mt), the main crops with a gross value of $8 billion and $2 billion respectively. Sugarcane, cotton, and viticulture are worth a total of around $4.2 billion, while other horticultural crops add another $8 billion. The Australian beef, sheep, and dairy industries are largely pasture-based and the gross value of slaughtering is over $7.3 billion, while dairy products ($4.7 billion) and wool ($2.6 billion) are also significant industries. Grain and red meat production is highly variable due to seasonal conditions and growers are careful with the allocation of production resources. Figure 1 shows this level of production variability over the past decade.
Figure 1, Annual crop area and production (summer and winter crop).
The dairy industry, with around 5 million cows, is the dominant agricultural industry in New Zealand, with around 40% of the gross value at the farm gate. Sheep and beef meats make up another 30% of value of production. Grain production is relatively modest at 800 kt, but the crops are typically intensively managed and high yielding. Horticulture, including fresh fruit and viticulture, are also high value intensive industries focused on quality products.
Both Australia and New Zealand have a strong history of agricultural research and development and have excellent public and private research organizations. Research is world class and funding models most commonly include public and private partnerships, with industry support through compulsory levies on production providing growers with leverage over the strategic and tactical issues addressed. However, declining strategic investment by government has reduced the number of research scientists and the number of graduates entering research careers in agriculture.
Most farms in Australia and New Zealand are family owned and operated. Farm size depends on the region and enterprises undertaken. For example,
· a dairy farm in Victoria would milk 350 cows on 250 ha of irrigated or rain-fed pasture, with additional feed supplements bought in. These cows would produce around 5,700 l milk per year and it would require around 2.5 labour units to run these farms. Most milk is consumed domestically, but 34% is exported as cheese, butter, and milk powders. The Australian industry contributes 6% of the world dairy trade, but New Zealand accounts for 34% of the global trade.
· A grain farm in Western Australia is around 4,000 ha, and would grow wheat, canola, barley and lupins or other pulse crops in rotation. The average yields for most crops would be between 1.2 and 1.8 t/ha, and in very good years, wheat yields of 4 t/ha are achievable in the moderate rainfall areas. Farmers aim to produce 20 kg grain for each millimeter of annual rainfall, and yields are higher in the areas closer to the coast and lower further inland and variations in rainfall in all zones greatly influences yields, income and profit. Most of the grain produced is exported.
· A sugar cane farm in northern Australia would farm 130 ha of cane producing 90 t raw cane/ha each year to yield about 12 t/ha of sugar. Each year the grower will plant 20-25% of the area with fresh (plant cane) and the remaining areas will produce second, third or fourth year crops of ratoon cane. The area will be replanted when the stand starts to fail. Production is highly mechanized both in planting and harvesting, and cane-crushing plants are located throughout the production regions. Eighty percent of the sugar produced is exported.
Table 2 gives the key statistics in terms of production in Australia and New Zealand. Data sets are incomplete for New Zealand and are presented as totals for the country. Australian data is presented for 2014 on a state-by-state basis. Low water supply for the rice and cotton industry – due to prolonged drought – has seen these two industries decline over the decade. For example, the rice industry contracted to around 2,000 ha in 2007-08 and with better seasons and improved water availability increased to 113,000 ha in 2012-13 producing 1.46 Mt of rice in that season. For the other industries, seasonal variations in rainfall have meant high var[attachment "Screen Shot 2017-03-03 at 13.13.07.png" deleted by Robert M Norton/IPNI] iability in yields from year to year.
Points to note from Table 2:
Australia
· The grains industry (wheat, coarse grains, oilseeds and pulses) produces around 42 Mt of grain annually, with about 10% summer crops, principally sorghum. The vast majority of the grains industry is rain fed (not irrigated).
· Winter crops are grown in all states, but summer crops are mainly produced in Queensland and northern New South Wales, which has a summer dominant or equi-seasonal rainfall pattern.
· Total annual grain production is widely variable, and over the past decade ranged from 19.8 Mt (2006-07) to 51.2 Mt (2010-11) and this variability is largely due to variable rainfall.
· The top three crops are wheat, barley and canola, and these are grown in the southern and western states, most often in rotation with each other and with pulse crops and pastures for sheep grazing.
· Over the past 20 years, the area of crops produced in the high rainfall zones (>600 mm average annual rainfall) has dramatically increased. Poor livestock profitability and the development of better cultivars and agronomic support has driven this change.
· Sheep numbers have reduced in the southern states as cropping has become more profitable.
· Half the beef cattle herd is in northern Australia, while Victoria is the principal dairy farming state.
· Although there are dairy regions in most states for fresh milk, the main milk production state is Victoria with over a million cows. The dairy industry has contracted during the past 10 years, but is now showing considerable growth. There are around 6,000 dairy farmers in Australia and they produce 9.7 billion litres of milk annually.
· Sugar cane is produced along the sub-tropical and tropical regions of the north-east coastline, and is highly productive and relatively stable industry, but is very exposed to international sugar prices. There are around 3,500 cane farms, most in Queensland.
· Wine grapes are a significant industry, largely based in South Australia, New South Wales and Victoria. These regions produce premium quality wines for export and domestic consumption. The area of production can fluctuate in response to the market demand for different varieties.
· Given the extent of latitude in Australia, from the tropics of Cape York at 12oS to the temperate maritime climate of southern Tasmania at 42oS, there is a great diversity in the types of crops produced, in particular in horticultural crops. Northern Australia produces tropical crops like mangos, avocado, macadamias, bananas (3,500 ha), pineapples (3,700 ha) and citrus, with small plantings of Asian crops such as rambutan and mangosteen. In the south, temperate tree crops like apples, pears, peaches, apricots, almonds and olives are produced.
· Citrus is grown in all states except Tasmania and the main production regions are along the Murray River. The main crops are oranges, but lemons, grapefruit and mandarins are common.
· Vegetable production is invariably under irrigation, and most major cities have farms producing for their local consumption. The largest areas grown are to potatoes (29,500 ha), tomatoes (5,000 ha), pumpkins (6,275 ha), lettuce (7,925 ha), carrots (2,146 ha) and melons (6,346 ha). Much of the vegetable production is consumed fresh locally, but export to south-east Asia represent developing markets, especially from the Northern Territory and Western Australia.
Notes: a. New Zealand statistics only give areas, not production. b. Statistics combine area and per-tree data; c statistics incomplete, improved pastures cited, state data is for 2012; d. Cows in milk only given. * No data.
New Zealand
· Grain production is mainly around the Canterbury plains in the mid part of the east side of the South Island, although maize is produced across much of the North Island. Yields of grains are very high due to the long growing season.
· The dairy industry in New Zealand is the largest single agricultural industry, with around 8,000 dairy farms covering a total of 1.8 Mha. Average farm size is 146 ha and this supports around 420 cows. 74% of the herd is on the North Island, and the Waikato region in the central North Island supports 34% of the herd alone.
· Sheep numbers have declined 45% over the period 1992-2015, while the dairy herd has increased by around 80% in the same period. There has been a change from sheep grazing (wool and meat) to dairy farming in many regions of New Zealand.
· Like Australia, the wine grape industry is strong, with the Marlborough region at the north-eastern end of the South Island hosts around 65% of the vine area. The most commonly produced variety is Sauvignon Blanc.
· 88 M trays of Kiwifruit are produced on 11,000 ha, and this fruit is exported to 47 countries with a value of $931 MNZD (fob). Orchard gate returns from kiwifruit are around $50,000/ha.
· Apples are the other major horticultural commodity, with 8,429 ha of orchards exporting fruit worth $536M NZD (fob).
· Other Horticultural crops include avocados, berry fruits, olives, citrus and stone fruits.
· The major vegetables produced are potatoes, onions, squash, carrots and brassicas.
Fertilizer Use In Australia and New Zealand.
Table 3 gives some key statistics concerning the use of macronutrient fertilizers in Australia and New Zealand. In 2014, there was approximately 6 Mt of fertilizer sold in Australia, and this amount is about 20% higher than the 10 year average. The use of all fertilizers has grown over the past decade, and parallels the increase in agricultural production, although there are large annual fluctuations due to seasonal conditions. The use of N in particular has grown in both Australia and New Zealand, with increased reliance on fertilizer N rather than N fixed by legumes in the pastoral and agricultural industries. The use of phosphorus fertilizer has been an historic part of the development of agriculture and its current use underpins most production systems with basal applications at seeding in the cropping industries and top-dressing of pastures for the grazing industries. Potassium use is relatively low compared to other nutrients as many soils – other than in Western Australia - have inherently high K status, although there is depletion noted in some areas as farming systems become more intensive.
Table 2 Nitrogen (N), phosphorus (P2O5) and potassium (K2O) use in Australia and New Zealand. Australian data is from Fertilizers Australia and the New Zealand data combined from IFA and Fertilizer Research NZ statistics.
| Year Commodity | 2000 | 2010 | 2014 | 2014 | 2002 | 2010 | 2014 | |||||
Australia | NSW | Vic. | Qld | SA | WA | Tas. | New Zealand | |||||
| Nitrogen Use (kt N) | 1,099 | 850 | 1,407 | 285 | 304 | 221 | 185 | 385 | 27 | 231 | 341 | 428 |
| Phosphorus (kt P2O5) | 1,098 | 642 | 909 | 192 | 252 | 50 | 144 | 241 | 29 | 457 | 325 | 350 |
| Potassium (kt K2O) | 202 | 157 | 235 | 13 | 54 | 61 | 10 | 79 | 20 | 126 | 97 | 139 |
A range of fertilizer products are used in Australia, with urea being the dominant N source. The use of urea has increased significantly over the past decade, in response to increases in productivity and some better seasons. MAP is the dominant P fertilizer used in cropping systems, although DAP is also common. Single superphosphate (SSP) was the dominant P source used in all agriculture, but its use as declined as MAP/DAP replace it in cropping systems. SSP is the most commonly used P source in Australia and New Zealand grazing systems, supplying both S and P. Horticultural industries have very diverse patterns of fertilizer use, both within and between various production systems. Fluids, controlled release, high analysis and other specialty products are used in high value crops, while manures are commonly used where available.
Table 3 Fertilizer products use (2014).
NZ Total (kt)* | AUS Total (kt) | |
| Urea | 736 | 1,844 |
| SOA | 27 | 380 |
| UAN | 0 | 383 |
| DAP | 237 | 474 |
| MAP | 2 | 813 |
| TSP | 4 | 24 |
| SSP | 1300 | 765 |
| MOP | 239 | 307 |
| Total** | 2,545 | 6,051 |
* estimated; ** includes other products | ||
- · The typical dairy farm in Victoria discussed earlier would annually use approximately 150 kg N/ha, applied as urea, in the autumn and spring, 20 kg P/ha and 16 kg K/ha. The use of N on dairy farms has increased over the past 10 years as pastures change from mixed clover and ryegrass to more grass dominant, and more feed is grown on farm in fodder crops.
· Sugar farmers in northern Queensland will be managing plant cane crops (first year) as well as first, second, third or fourth ratoon crops across their farms. Plant crops are established in the dry winter/spring and will grow for 9-16 months between harvests. The crop is harvested when it is about 2-4 m tall. On average growers spend around $500/ha on fertilizer, which is about 15% of total costs. Often the entire crops P and K requirements and part of the N needs are applied at planting. The use of N is usually during the very early wet season as a single application over small cane, and the rates are around 200 kg urea/ha/year. Nitrogen use in the wet tropics is under intense scrutiny due to the proximity of the Great Barrier Reef to some production regions.
The Fertilizer Industry in Australia and New Zealand
In Australia, the industry-based organization is Fertilizer Australia, which draws its membership from the manufacturers, importers and distributors of fertilizers to Australia. Fertilizer Australia's role is to effectively manage issues that are common to members, where an industry wide approach is likely to be more effective than the actions of individual companies. It manages industry stewardship programs relating to the training and accreditation of fertilizer industry advisors, applicators and those in storage and handling. The Fertcare® program is a key part of its activities and it offers training to agronomists who provide fertilizer advice to growers.
In New Zealand, the peak industry body is the Fertilizer Association of New Zealand, which represents the two major producers and distributors of fertilizers. These two
companies, Ballance Agri-Nutrients and Ravensdown Fertiliser Co-operative manufacture, distribute and market around 98% of all fertilizers sold in New Zealand. It promotes and encourages responsible and scientifically based nutrient management. It does so by developing training programs, funding research, participating in government and local working groups and through liaison with other agricultural industry organizations.
Decisions about on-farm fertilizer use are made by growers, usually with the advice of public or private agronomic advisors. Soil testing is commonly used to determine likely responses and there is strong scientific basis for the use of fertilizers. The industry organisations support this evidence-based approach to nutrient management, along with education and self-regulation. They hold these values strongly and work together with government to ensure the best outcomes to meet the economic, social and environmental goals of the societies in which they operate.
Summary
- ¥ Agriculture in Australia and New Zealand are strong and export oriented industries, exposed to world market price fluctuations.
¥ Fertilizer use follows and contributes to the growth of these industries.
¥ Seasonal conditions mean high volatility in production, profitability and the use of fertilizer.
¥ Intensification in the grains and dairy industries have increased the use of urea and AP fertilizers.
¥ Farmers are innovative, adaptable and demanding.
¥ There is strong industry self-regulation and high standards of business integrity in both countries.
The International Plant Nutrition Institute (IPNI) is a not-for-profit, science-based organization dedicated to the responsible management of plant nutrition for the benefit of the human family. IPNI began operating in January of 2007 and now has active programs in Africa, Australia/New Zealand, Brazil, China, Eastern Europe/Central Asia and Middle East, Latin America-Southern Cone, Mexico and Central America, Northern Latin America, North America (Canada and U.S.A.), South Asia, and Southeast Asia.
Dr Ping He is the Regional Director for China, and is based in Beijing. Dr He is assisted by Dr Shutian Li (Beijing), Dr Fang Chen (Wuhan) and Dr Shihua Tu (Chengdu). Details of this program can be found at http://china.ipni.net.
As a global organization, IPNI has initiatives addressing the world’s growing need for food, fuel, fiber, and feed. There is widespread concern for issues such as food security and the relationship of crop production to the environment and ecosystems. IPNI programs are achieving positive results in many areas. The program coordinators and IPNI regional directors are Ph.D. scientists. Through cooperation and partnering with respected institutions around the world, IPNI adds its strengths to agronomic research, education, demonstrations, training, and other endeavors. Best management practices for nutrient stewardship encourage the concept of applying the right product (source), at the right rate, at the right time, and in the right place.
Membership in IPNI is composed of companies that are basic producers of one or more of the major plant nutrients (nitrogen, phosphate, potash, and sulfur) for agricultural purposes. Large retail organizations that do not qualify as basic producers may qualify as associate members. Certain other organizations qualify as affiliate members. A listing of current members of IPNI can be found at http://www.ipni.net.
Data sources:
Australian Bureau of Statistics, Agricultural Commodities (Quarterly).Australian Bureau of Agriculture and Water Resources, Australian Crop Reports (Quarterly).
Australian Bureau of Statistics, Australian National Accounts: National Income, Expenditure and Product (Quarterly).
Australian Bureau of Statistics, Land Management and farming in Australia (Annual).
Fertilizer Australia, Fertilizer Use Data.
IFA Fertilizer use data
IFA – Fertilizer use by crops.
Statistics New Zealand, Agricultural Production Statistics (Annual)
Statistics New Zealand, National Accounts (Income and Expenditure).
Plant and Food Research, Fresh Facts (New Zealand).Statistics New Zealand, Infoshare.
Importing fertilizers to Australia - http://www.agriculture.gov.au/import/goods/fertiliser#what-contaminants-can-be-found-in-fertiliser
Importing fertilizers to New Zealand - https://law.resource.org/pub/nz/ibr/nzs.bio.inorgfert.all.2012.pdf
Additional Resources
PPT of presentationSize: 0.39 MB
Regional Profile 2010Size: 1.37 MB
Paper presented at Shanghai, March 2016.Size: 0.4 MB