08 Feb 2013
Fertilizer Expenditure in the Australian Grains Industry
Summary from ABARES Farm Input Surveys
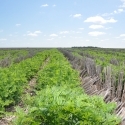
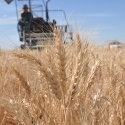
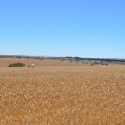
 Wheat Crop Wimmera
Fertilizer Expenditure of Grain Farms in Australia.
The Australian grains industry produces around 40 Mt of wheat, barley, oats, canola, pulses and other grains each year. The production systems vary from high rainfall zone intensive production with high yield potentials, to low rainfall opportunity cropping. Most of the grain production is rainfed, and so varies from year to year.
The data below is taken from a series of reports on farm costs for grain and mixed farming properties in each of the agroecological zones. The years surveyed were 2006-2007, 2007-2008 and 2008-2009, and the results reported are the average for those three years. Mean yields over these periods are lower than the long term average for Australia due to drought with annual wheat production of 10.8 Mt (2006-2007), 13.6 Mt (2007-2008), 21.4 Mt (2008-2009), 21.8 Mt (2009-2010), 27.4 Mt (2010-11) and 29.9 Mt (2011-2012). Production for the current 2012-2013 crop season is forecast at 22.0 Mt.
The amounts spent on fertilizers are generally the largest single variable cost for grain producers, and are 15-20% of all cash costs, or 20-25% of variable costs.
Figure 1: Australian agroecological zones, Grains Research and Development Corporation.
Table 1: Physical performance benchmarks for grain farms in Australia (2006-07 to 2008-09), averages per farm.
Table 1a | Specialist Grain Farms $/ha | ||||
| Region | Av Rainfall (mm) | Farm Size (ha) | Cropped area (ha) | % wheat | Ave. Wheat Yield t/ha |
| Central NSW | 340 | 2459 | 666 | 75 | 0.7 |
| NSW & Vic Slopes | 443 | 1730 | 1059 | 59 | 0.8 |
| Vic HRZ & Tas | 447 | 1034 | 550 | 39 | 2.1 |
| SA & Vic Wimmera | 365 | 880 | 580 | 33 | 1.3 |
| SA & Vic Mallee | 288 | 2596 | 1482 | 61 | 0.7 |
| SA Mid North, | 404 | 1327 | 747 | 46 | 1.4 |
| WA Sandplain | 470 | 4959 | 3008 | 46 | 1.9 |
| WA Northern | 278 | 8770 | 2901 | 79 | 1.1 |
| WA Eastern | 280 | 5081 | 2589 | 86 | 0.9 |
| WA Central | 340 | 3365 | 1858 | 59 | 1.6 |
| North west NSW/SW Qld | 548 | 9838 | 3261 | 63 | 1.2 |
| North east NSW/SE Qld | 614 | 1547 | 810 | 50 | 1.7 |
| Central Queensland | 635 | 4119 | 2310 | 52 | 2.0 |
Table 1b | Mixed Farms $/ha | ||||
| Region | Av Rainfall (mm) | Farm Size (ha) | Cropped area (ha) | %wheat | Ave. Wheat Yield t/ha |
| Central NSW | 335 | 4984 | 770 | 67 | 0.9 |
| NSW & Vic Slopes | 457 | 1470 | 415 | 59 | 0.8 |
| Vic HRZ & Tas | 522 | 1047 | 178 | 25 | 2.5 |
| SA & Vic Wimmera | 460 | 1041 | 287 | 35 | 1.2 |
| SA & Vic Mallee | 330 | 1907 | 732 | 55 | 0.9 |
| SA Mid North, | 427 | 1440 | 441 | 48 | 1.2 |
| WA Sandplain | 507 | 3617 | 1159 | 37 | 1.8 |
| WA Northern | 343 | 3610 | 1031 | 67 | 1.1 |
| WA Eastern | 272 | 3992 | 1766 | 72 | 1.1 |
| WA Central | 419 | 1974 | 1402 | 53 | 1.7 |
| North west NSW/SW Qld | 533 | 4424 | 624 | 72 | 1.0 |
| North east NSW/SE Qld | 612 | 1990 | 290 | 44 | 1.5 |
| Central Queensland | 628 | 7762 | 580 | 47 | 1.7 |
Table 2. The amount spent on fertilizers as a proportion of total cash costs on Australian grain farms.
| Region | Specialist Grain Farms $/ha | Mixed Farms $/ha | ||||
Fertilizer | Total Cash Cost | % Fert | Fertilizer | Total Cash Cost | % Fert | |
| Central NSW | 15.30 | 122 | 13% | 6.80 | 108 | 6% |
| NSW & Vic Slopes | 40.40 | 239 | 17% | 20.10 | 217 | 9% |
| Vic HRZ & Tas | 68.70 | 457 | 15% | 35.50 | 266 | 13% |
| SA & Vic Wimmera | 41.1 | 274 | 15% | 30.3 | 255 | 12% |
| SA & Vic Mallee | 24.90 | 130 | 19% | 17.30 | 116 | 15% |
| SA Mid North, | 47.20 | 278 | 17% | 21.60 | 157 | 14% |
| WA Sandplain | 73.70 | 327 | 23% | 53.30 | 223 | 24% |
| WA Northern | 21.90 | 102 | 21% | 22.10 | 115 | 19% |
| WA Eastern | 21.30 | 114 | 19% | 34.20 | 162 | 21% |
| WA Central | 49.30 | 230 | 21% | 41.50 | 213 | 19% |
| North west NSW/SW Qld | 4.40 | 157 | 3% | 1.40 | 72 | 2% |
| North east NSW/SE Qld | 31.40 | 343 | 9% | 9.30 | 185 | 5% |
| Central Queensland | 14.40 | 298 | 5% | 2.40 | 86 | 3% |
Table 3. The amount spent on fertilizers as a proportion of variable costs on Australian grain farms.
| Region | Specialist Grain Farms $/ha | Mixed Farms $/ha | |||||
Fertilizer | *Crop Costs | % Fert | $/cropped ha** | Fertilizer | *Crop Costs | % Fert | |
| Central NSW | 15.3 | 93 | 16% | 56 | 6.8 | 53 | 13% |
| NSW & Vic Slopes | 40.4 | 178 | 23% | 66 | 20.1 | 121 | 17% |
| Vic HRZ & Tas | 68.7 | 357 | 19% | 129 | 35.5 | 191 | 19% |
| SA & Vic Wimmera | 41.1 | 219 | 37% | 62 | 30.3 | 190 | 16% |
| SA & Vic Mallee | 24.9 | 111 | 22% | 44 | 17.3 | 86 | 20% |
| SA Mid North, | 47.2 | 231 | 20% | 84 | 21.6 | 121 | 18% |
| WA Sandplain | 73.7 | 275 | 27% | 122 | 53.3 | 170 | 31% |
| WA Northern | 21.9 | 76 | 29% | 66 | 22.1 | 81 | 27% |
| WA Eastern | 21.3 | 84 | 25% | 42 | 34.2 | 114 | 30% |
| WA Central | 49.3 | 190 | 26% | 89 | 41.5 | 155 | 27% |
| North west NSW/SW Qld | 4.4 | 110 | 4% | 13 | 1.4 | 43 | 3% |
| North east NSW/SE Qld | 31.4 | 267 | 12% | 60 | 9.3 | 107 | 9% |
| Central Queensland | 14.4 | 246 | 6% | 26 | 2.4 | 55 | 4% |
* Crop costs were derived from the total cash cost, less administration, livestock purchases, fodder, shearing and interest.
** $/cropped ha for specialist grain farms assumes that all the fertilizer is applied to the cropping areas.
Sources: ABARES GRDC Reports, 2011 (Various Authors)
- Physical and financial performance benchmarks for grain producing farms, New South Wales central agroecological zone.
- Physical and financial performance benchmarks for grain producing farms, New South Wales - Victoria slopes agroecological zone.
- Physical and financial performance benchmarks for grain producing farms, Victorian high rainfall agroecological zone and Tasmanian grains area.
- Physical and financial performance benchmarks for grain producing farms, South Australia and Victoria Bordertown-Wimmera agroecological zone.
- Physical and financial performance benchmarks for grain producing farms, South Australia and Victoria Mallee agroecological zone.
- Physical and financial performance benchmarks for grain producing farms, South Australia mid-north - lower Yorke and Eyre agroecological zone.
- Physical and financial performance benchmarks for grain producing farms, Western Australian Mallee and Sandplain agroecological zone
- Physical and financial performance benchmarks for grain producing farms, Western Australian northern agroecological zone
- Physical and financial performance benchmarks for grain producing farms, Western Australian eastern agroecological zone
- Physical and financial performance benchmarks for grain producing farms, Western Australian central agroecological zone
- Physical and financial performance benchmarks for grain producing farms, New South Wales north-west and Queensland south-west agroecological zone
- Physical and financial performance benchmarks for grain producing farms, New South Wales north-east and Queensland south-east agroecological zone
- Physical and financial performance benchmarks for grain producing farms, Queensland central agroecological zone.