05 Jun 2014
Better Fertilizer Decisions for Crops
Project summary and access to the data interrogator
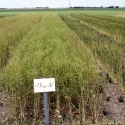
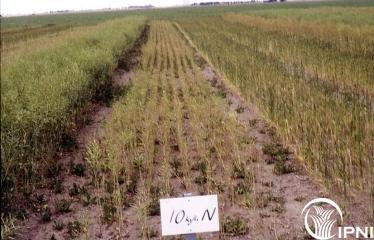 Canola 010 kg N/ha
This paper was presented at the Argentinian Soil Science Society Conference (May 2014). A version will be reprinted in the Journal of the Australian Institute of Agriculture (June 2014), and aother version is to be presented at the Asian Federation for Information Technology in Agriculture (October 2014). It will also be published in Better Crops (Issue #3, p8-9, 2014).
A web-based database to support soil test calibration
Simon Speirs1, Mark Conyers1, Ken Peverill2, Chris Dyson3, Graeme Watmuff4,Rob Norton5, the late Doug Reuter.
1 Industry and Investment NSW, www.industry.nsw.gov.au, Email simon.speirs@industry.nsw.gov.au
2 K I P Consultancy Services, Email ken.peverill@bigpond.com
3 South Australian Research and Development Institute, Email chris.dyson@sa.gov.au
4 Geographic Web Solutions, Email gwatmuff@geographicweb.com.au
5 International Plant Nutrition Institute, http://anz.ipni.net. rnorton@ipni.net
Abstract
Almost 6,000 fertilizer response experiments on cereal, oilseed and pulse crops from across Australia were collated and made available through a web-based tool. Advisers can use this tool to estimate soil test critical ranges by crop, region, soil type and nutrient.
(paper presented at the Soil Science Society of Argentinia Conference, Bahia Blanca, Argentina)
Soil testing remains a most valuable tool for assessing the fertiliser requirement of crops. The relationship between soil tests (generally taken from surface soil) and relative yield (RY) response to fertiliser is subject to the influence of environment (e.g. water, temperature) and management (e.g. cultivation, sowing date).
The traditional way to determine soil test critical values if from experiment-specific critical values which are season and soil type specific and lack statistical power to make reliable estimates. In many cases, the experiments used to define critical values are only ones where significant responses are seen, so non-responsive sites are not represented. As such, the degree of precision is often low when the soil test calibration is based on a wide range of independent experiments on many soil types over many years by many different scientists.
To aggregate existing soil test and crop response data, an on-line MySQL database of historic fertilizer response trials has been developed for cereals, pulses and oilseed crops in Australia’s diverse cropping regions. The data includes 5420 single and multiple nutrient field experiments fro five decades of research. It consists data from all available nitrogen (1709 experiments), phosphorus (2281 experiments), potassium (356 experiments) and sulfur (270 experiments) trials. Minimum data trial requirements were applied which stipulated the soil type was recorded, a recognized soil test had been undertaken, and than an estimate of crop yield with no fertilizer (Y0) and the maximum yield (Ymax) could be obtained from the rate range used. Crop grain yield responses were fitted with either Mitscherlisch, quadratic or logistic functions to estimate Y0 and Ymax, and the percentage of RY as 100*Y0/Ymax.
Using the trial data, soil test critical values can be derived on-line through the Better Fertilizer Decisions for Cropping Interrogator Tool, which was specially developed for manipulating, sorting and search the database. A trained and registered user is able to filter the data by attributes that include crop type, soil type, soil test, yield and growing season rainfall. Fertilizer response criteria are obtained by fitting an inverted plot of the natural logarithm for the soil test and the arcsin of the square root of RY. From these curves, critical soil test values and confidence limits for 80%, 90% and 95% of RY can be derived.
Figure 1 shows three screen shots from the web-based interface. The first screen (Fig 1a) allows the user to select trials based on the nutrient (N, P, K or S), the crop, the soil types of interest, a state or a selected region, a time scale and from irrigated or dryland farming systems. The second screen (Fig 1b) allows a soil test and sampling depth to be selected from the database, as well as some additional filters such as soil pH, soil texture, drought, etc. The fertilizer response curve against soil test value is presented to the user on the screen with these values indicated as well as correlation values for the relationship (Fig 1c).
(A) (B)
(C)
Figure 1. An example of the online Interrogator interface at the first (a) and second stages (b) of database interrogation and the final report (c) on the derived critical soil test value.
The Interrogator enables users from the grains and fertilizer industries to better estimate soil test critical values for their particular situations and so improve fertilizer management. The database underpins the Australian fertilizer industry’s Fertcare program for advisors making recommendations to grain growers. It also assists directs future research to address identified knowledge gaps. The Interrogator was commissioned in March 2012 and can be found at www.bfdc.com.au.
As well as developing the database and training users in extracting and interpreting the information, the core scientific group published a series of papers to document the processes undertaken, and the outcomes in terms of the reliability and critical values of particular soil tests. A special edition of Crop and Pasture Science (2013, Volmne 64) was devoted to soil test interpretation as well as procedures and lessons learnt from the project.
The process of collating and entering data was very time consuming and relied on a lot of unpublished data provided personally be soil fertility researchers as well as published information. A large amount of institutional input was required as well as good faith and trust among organisations and researchers on how the data were to be handled.
A second major issue we found was that the lack of standardized metadata for sites within the database makes it generally impossible to isolate the effects on critical values of the specific management or environmental factors which are therefore best determined by specific studies. The database provides guidance, but in general – even with the large set collated here, specific issues such as the impact of stubble retention or the effect of zero-tillage are not able to be addressed.
Finally, the database is dominated (60%) by responses of wheat to nitrogen and phosphorus, meaning that relatively few studies are available for responses by pulses (other than narrow leaf lupins) or oilseeds (other than canola), especially for potassium and sulfur. Moreover, limited data are available for current cropping systems and varieties. However, the identification of these gaps can now be used to focus future research on the crops, nutrients, soils, regions, and management practices where data are lacking.
The BFDC National Database and BFDC Interrogator is an approach that is worth examining for those nations that have a legacy of fertiliser response experiments but have not used ‘information technology’ tools to assemble their data. In those nations that are still conducting many fertilizer response experiments, the approach outlined for standardizing protocols and developing a database and an interrogator should be of great value for capturing long-term benefits from present investments.
Acknowledgements
The authors thank the Grains Research and Development Corporation for funding the work and the many scientists for their generous unpaid work to assist the development of this database.
The late Doug Reuter was a key member of the team that delivered this project.
For more information:
http://www.youtube.com/watch?v=4bhuZV9Pop8
Crop and Pasture Science, 2013, 64, Number 5, whole of edition.
Additional Resources
Power Point slides from presentationSize: 2.87 MB
Spanish Language Version (presented in Argentina)Size: 0.34 MB
English Language Version (presented in Perth 2014)Size: 0.81 MB
GRDC Fact Sheet BFDCSize: 0.75 MB